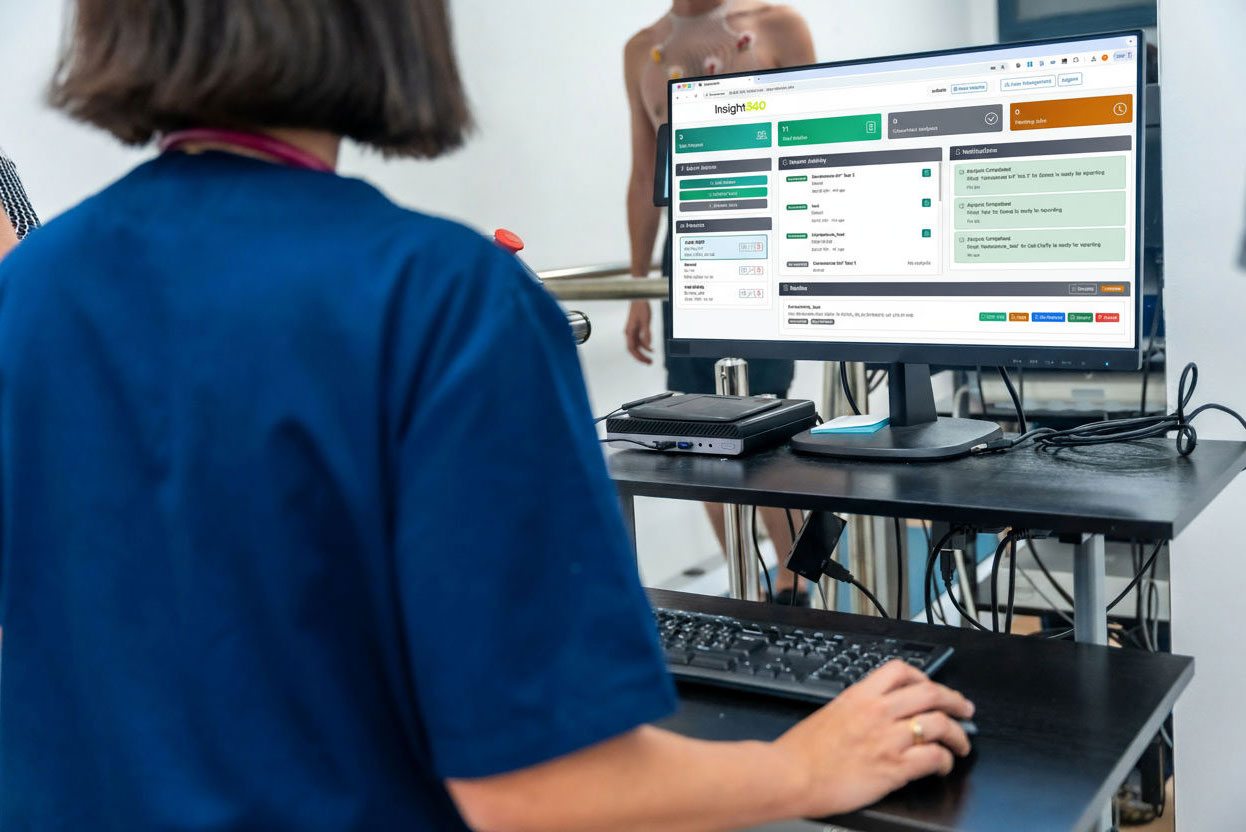
Turn Data Into Discovery:
Visualize Every Beat with MaxYield Insight360

See Your ECG Like Never Before

Analyze

Visualize

Report

Get Demo
Launch Insight360

From Signal to Story: Visualize Every Beat with MaxYield Insight360

Custom dashboards.
Configurable formulas.
Instant reports.

All powered by MaxYield™ ECG intelligence.

The Insight360 Process

Analyze
Upload any ECG, any length: MaxYield extracts every interval automatically
Visualize
Drag-and-drop widgets & formulas
Report
Export HTML/PDF instantly

Analyze

Upload in any ECG file. Insight360 syncs instantly with MaxYield™ for automated waveform labeling and noise isolation.

Visualize

“For the first time in history, we have an automated way of getting an accurate HRV that represents signal versus noise - beautiful.”

- Paul Dorian, MD
Professor of Medicine, University of Toronto;
Division of Cardiology, St Michael's Hospital

Report

Configure your preferred formulas for QTc, HRV, and ST analysis. Build once, templatize forever.
“A level of precision that rivals human expert interpretation - a new era in cardiac diagnostics.”

- Marc W. Deyell, MD MSc FHRS FCCS
Professor, Division of Cardiology, University of British Columbia; Director, Cardiac Electrophysiology, St. Paul’s Hospital
Available Metrics

Request Master Sheet

Thank you! Your submission has been received!
Oops! Something went wrong while submitting the form.
METRIC
Information

Name

Study

Date

Patient ID

File Name

Duration

METRIC
MaxYield™ Summary

Avg HR (bpm)

Normal Beats (%)

Arrhythmias (%)

Signal Quality (%)

Minimum HR (bpm)

Maximum HR (bpm)

Longest RR Interval

METRIC
Heart Rate

HR (bpm) vs. Time Graph
(Max Data Points Mode)

HR (bpm) vs. Time Graph
(Grouped by Time Mode)

Custom Configuration

Chart Type: Line or Bar
Plot Density: Avg bpm over X points / time
Group Interval: Avg bpm over X time
Group Method: Avg / Min / Max / Median
Show Min/Max (Toggle)
Adjustable Y-Axis (min & max)
Adjustable Chart Height
Label Display Density (how many points labeled)

METRIC
Events

Chronological Event List
(PVC, PAC, Pause, ST_Change, Other)

Sort by Time or Event Type

Filter by Event Type

Custom Configuration

Event Type Filter (PVC, PAC, Pause, ST_Change, Other)

METRIC
HRV Analysis
Time Domain Metrics

SDNN
RMSSD
pNN50
Mean RR

Clinical Assessment

• Overall Risk
• Autonomic Status

Data Quality Review

Custom Configuration

Formula Output & Range Display (Normal → High)
Quality Filter Threshold (%)
Risk/Autonomic Assessment Algorithm

METRIC
RR Interval Trend

RR Interval Trend Graph

HR (bpm) plotted over Time

Custom Configuration

Chart Type: Line or Bar
Plot Density (Avg bpm over X points / total time)
Adjustable Y-Axis (min & max)
Adjustable Chart Height
Label Display Density

METRIC
ST Segment Trends

ST Segment Duration plotted vs. Time

Signal Fluctuations visualized over recording

Custom Configuration

Chart Type: Line or Bar
Plot Density (Avg bpm over X points / total time)
Adjustable Y-Axis (min & max)
Adjustable Chart Height
Label Display Density

METRIC
Brady/Tachycardia

Time Beginning

Total Beats

Brady Beats

Time in Brady

Tachy Beats

Time in Tachy

Custom Configuration

Time Interval (minutes)
Bradycardia Threshold (bpm)
Tachycardia Threshold (bpm)
Show Percentages (Toggle)

METRIC
QT/QTc Analysis

QT (ms)

QTc (ms)

RR (ms)

HR (bpm)

QTc Trend Graph

Custom Configuration

QTc Formula: Bazett / Fridericia / Framingham / Hodges
QTc Range (ms)
Analysis Window (seconds)
QTc Guide Line (ms)
Adjustable Y-Axis (min & max)
Adjustable Chart Height
Exclude Ectopic Beats (Toggle)

METRIC
PVC/PAC Patterns
PVC Table

Total PVCs
Couplets
Triplets
Runs (4+)
Longest Run Length

PVC Pattern Details: Time | Pattern | Length | Duration

PAC Table

Total PACs
Couplets
Triplets
Runs (4+)
Longest Run Length

Custom Configuration

Max Gap Between Events (ms)
Minimum Run Length
Table Height (px)
Show Detailed Pattern Info (Toggle)

METRIC
AV Conduction Analysis

Avg P-Wave Duration (ms)

Avg PR Interval (ms)

Avg PR Segment (ms)

Data Quality (%)

1° AV Block (PR > 200ms)

Pre-Excitation (PR < 120ms)

Normal Conduction

AV Conduction Trend Graph

Custom Configuration

Analysis Window (seconds)
Chart Height (px)
1° AV Block Threshold (ms)
Pre-Excitation Threshold (ms)
Exclude Ectopic Beats (Toggle)
Toggle Display: P-Wave / PR Interval / PR Segment
Split into Separate Charts (Toggle)

METRIC
QRS Duration Analysis

Avg QRS Duration (ms)

Min QRS Duration (ms)

Max QRS Duration (ms)

Data Quality (%)

Wide QRS (≥120ms)

Bundle Branch Block (≥140ms)

Intraventricular Delay

Normal QRS

QRS Duration Trend Graph

Custom Configuration

Analysis Window (seconds)
Chart Height (px)
Wide QRS Threshold (ms)
Bundle Branch Block Threshold (ms)
Exclude Ectopic Beats (Toggle)

METRIC
Ventricular Repolarization

Avg ST Duration (ms)

Avg T-Wave Duration (ms)

ST Duration Quality (%)

T-Wave Duration Quality (%)

Long ST Duration

Long T-Wave Duration

Normal ST Duration

Normal T-Wave Duration

ST / T-Wave Trend Graph

Custom Configuration

Analysis Window (seconds)
Chart Height (px)
Wide QRS Threshold (ms)
Bundle Branch Block Threshold (ms)
Exclude Ectopic Beats (Toggle)

METRIC
EDF File Information
Recording Information

Start Date / Time / Duration

Technical Information

EDF Version
Number of Signals
Number of Records
Record Duration
Sampling Rate

Patient Information (from EDF)

Sex
Name
Birthdate

Signal Details Table: Channel | Label | Physical Dimension | Samples/Record

Custom Configuration

Toggle visibility per section (Recording / Technical / Patient / Signal Details)

Validation & Efficiency

“We can now study PR interval behavior in athletes, in sleep apnea, in exercise - all at scale. Before, this was manual work; now it's automated.”

“ST segments are not useful currently: when you have baseline wander, the ST segments are not meaningful. What you've done is filtered out the noise from ST segments with MaxYield”

Dr. Paul Dorian
- Cardiologist at St. Michaels Hospital, University of Toronto

Build Reports Your Way

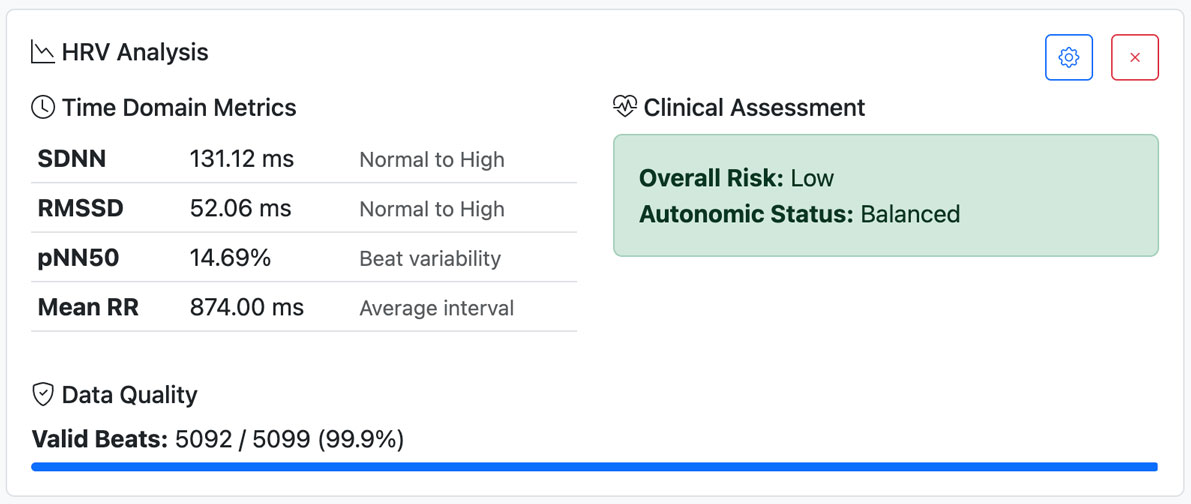
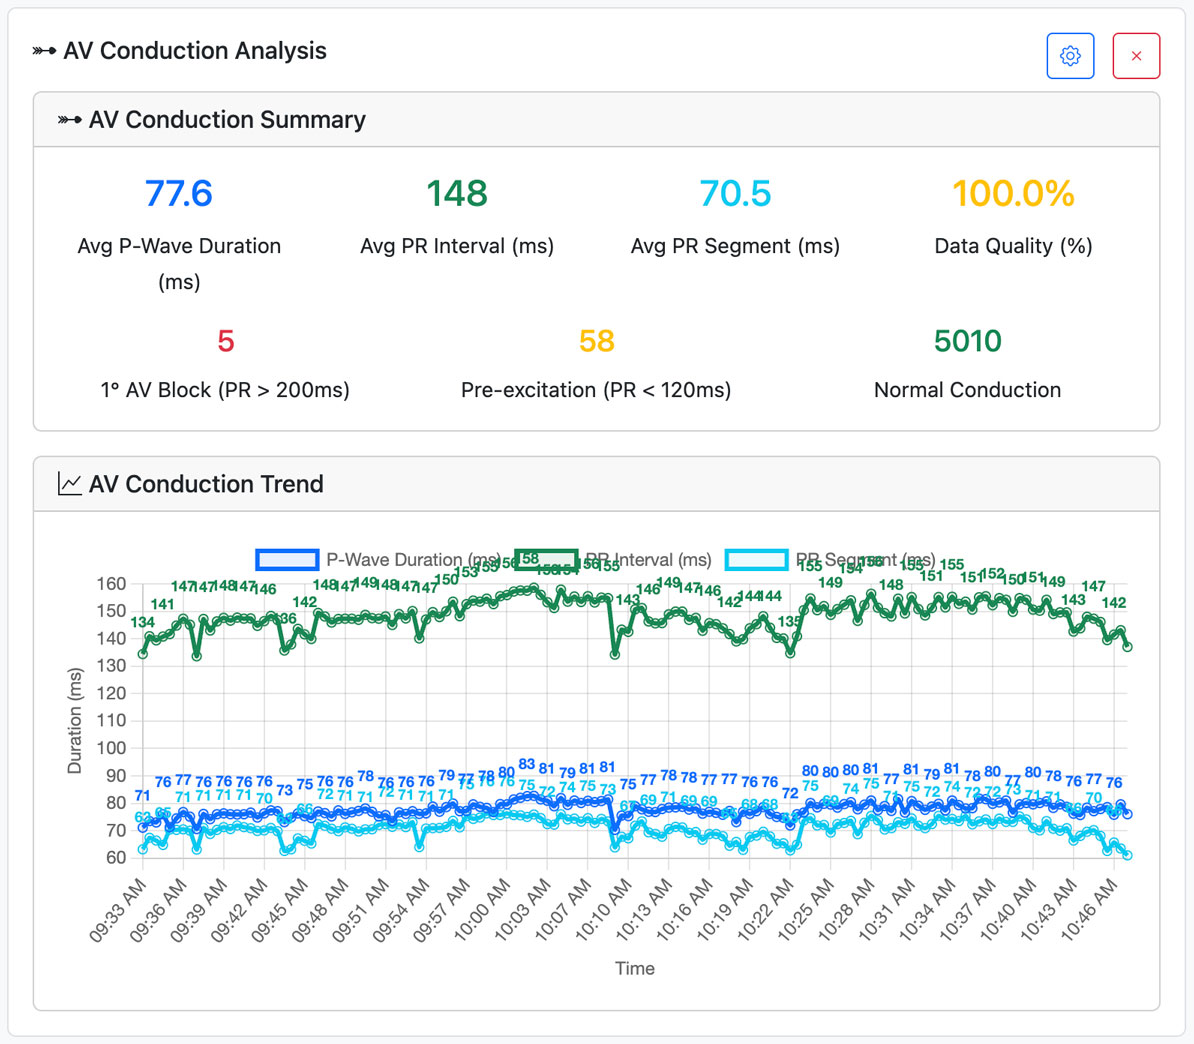
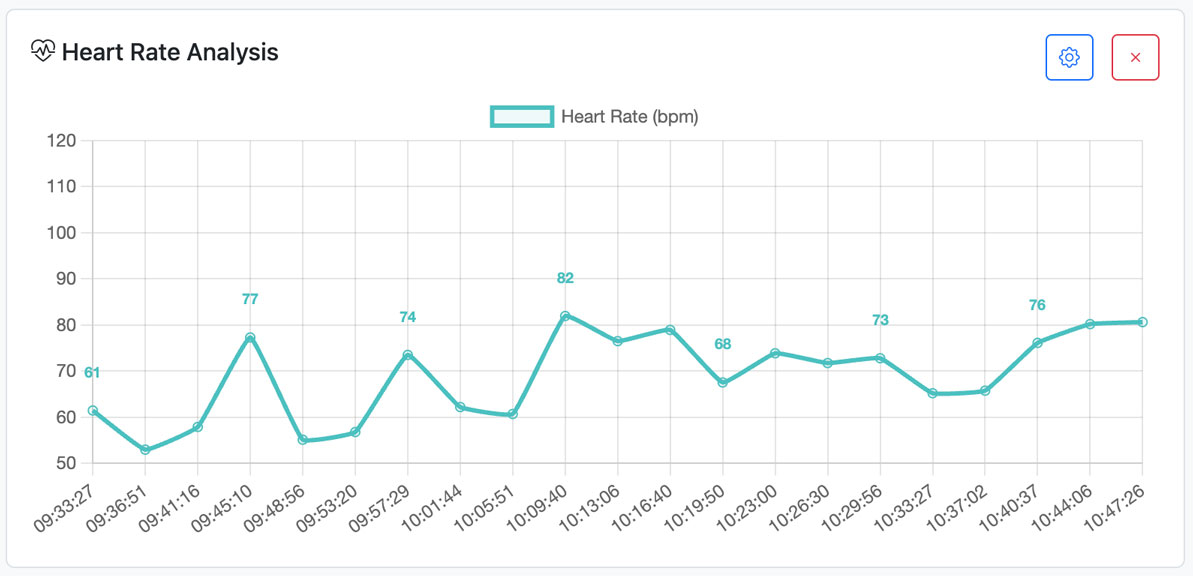
Switch formulas, apply filters, adjust parameters - every widget adapts to your analytic style.

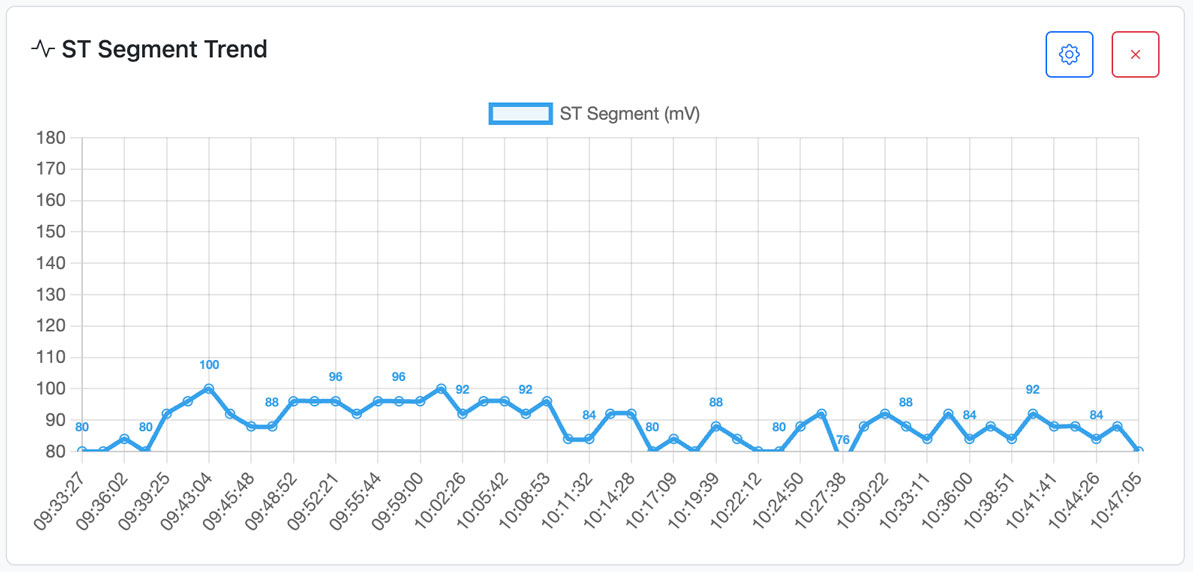
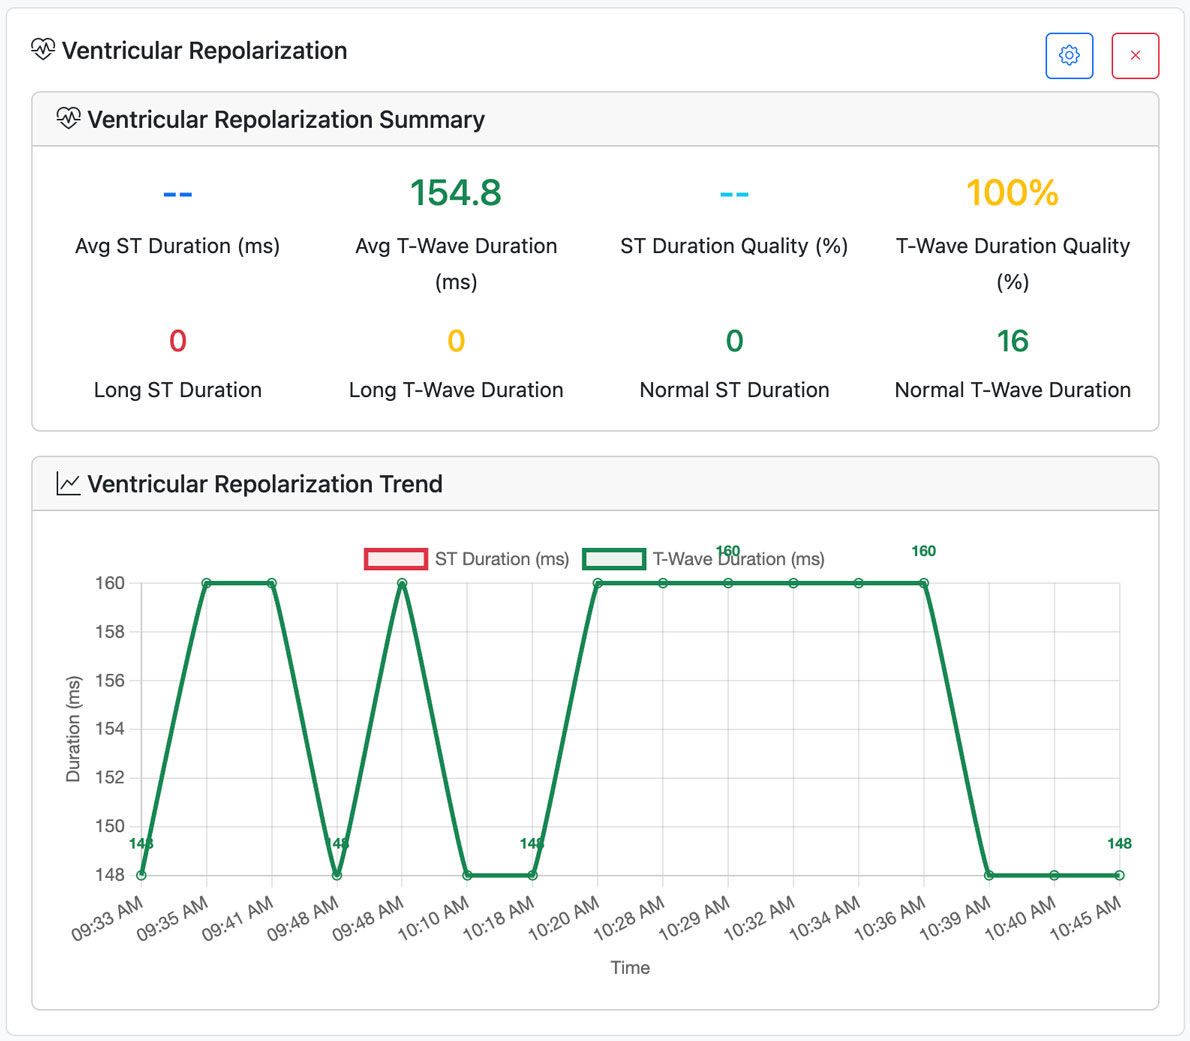
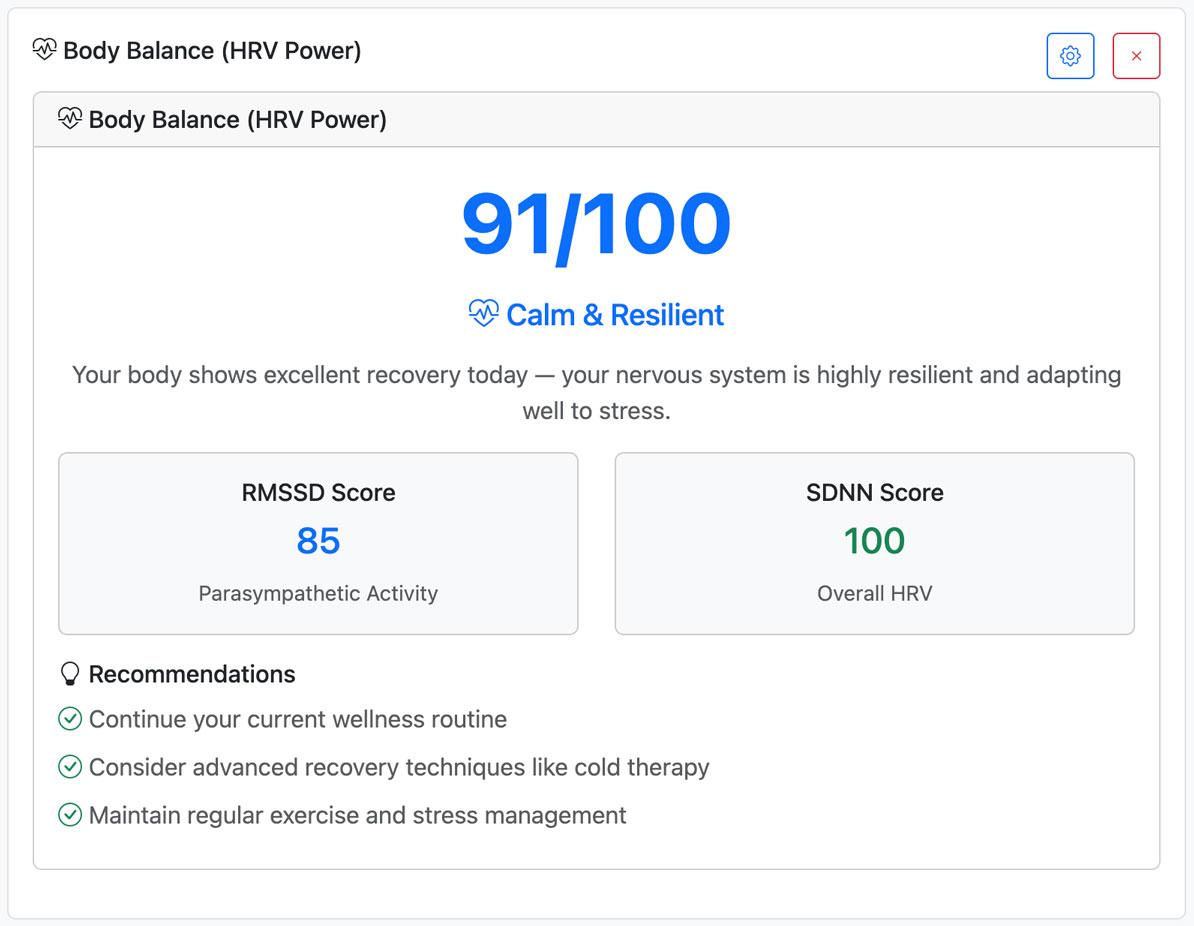
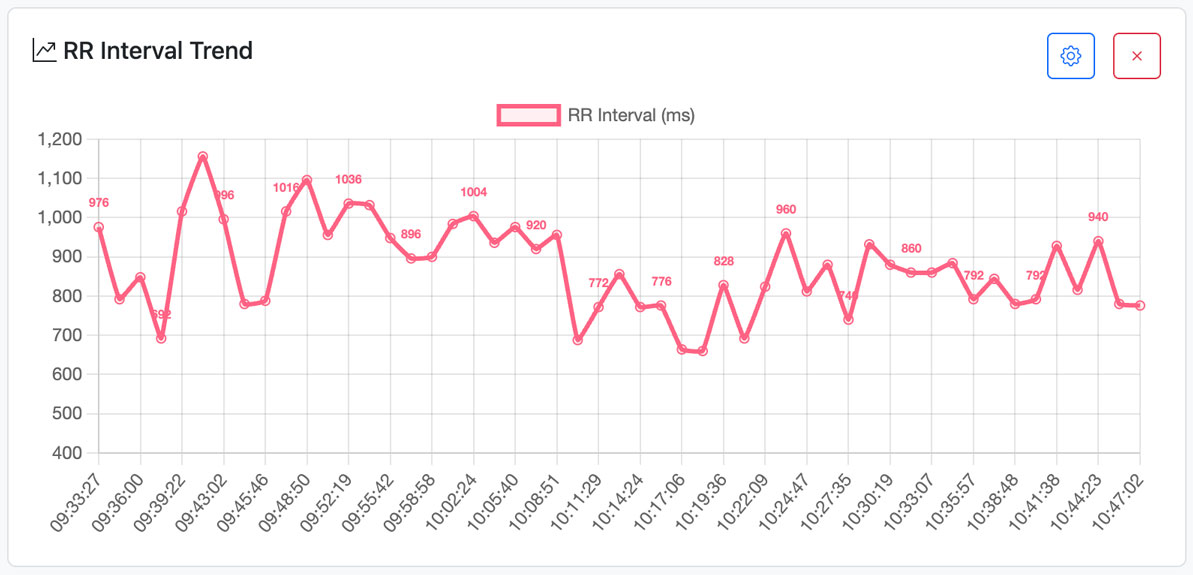
Heart Rate, HRV Analysis, RR Interval Trend, ST Segment Trends, Brady/Tachycardia, QT/QTc Analysis, PVC/PAC Patterns, AV Conduction Analysis, QRS Duration Analysis, Ventricular Repolarization

ECG Intelligence Made Simple

Interested in a Personalized Walkthrough?