Introduction
Many health tech developers encounter significant challenges when creating reliable heart axis charts, which are crucial for accurate ECG analysis. This guide will help developers master heart axis chart creation, providing the tools and insights needed to improve diagnostic accuracy.
But what can developers do when they face challenges, and how can they ensure their charts are precise and clinically relevant? Addressing these challenges is vital for ensuring that ECG analysis remains precise and clinically relevant.
Understand the Basics of Heart Axis and ECG Interpretation
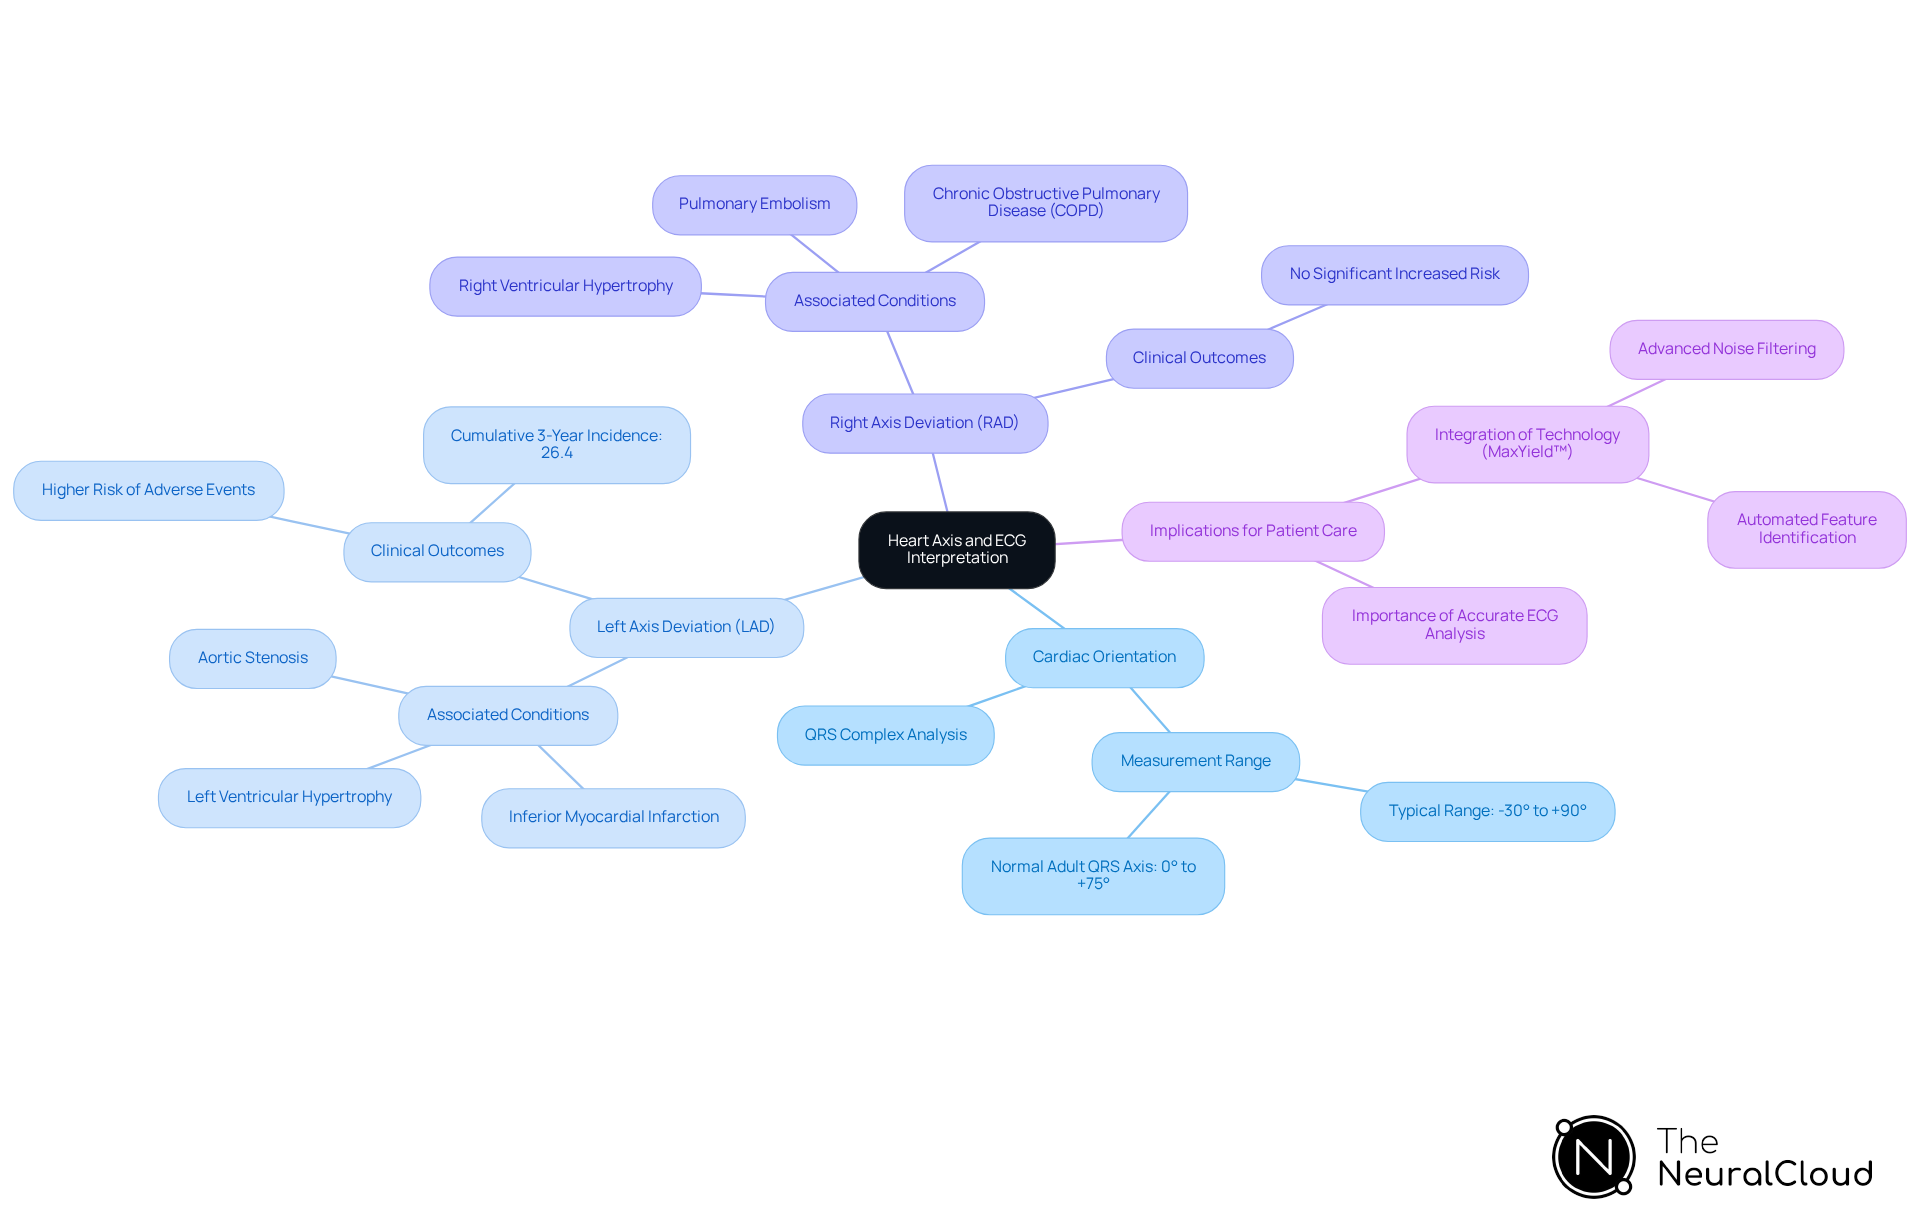
Understanding cardiac orientation is crucial for accurate ECG analysis and effective patient care. The heart orientation indicates the overall direction of electrical activity during depolarization, typically measured in degrees. A typical line ranges from -30° to +90°. Comprehending how to analyze the QRS complex in leads I and aVF is essential, as these leads provide the main information required for orientation determination.
Left deviation (LAD) occurs when the orientation shifts to the left of -30°, often linked with conditions such as left ventricular hypertrophy, inferior myocardial infarction, and aortic stenosis. Diagnosing conditions associated with left deviation can be challenging due to overlapping symptoms. On the other hand, right axis deviation (RAD) occurs when the direction shifts to the right of +90°, which can suggest right ventricular hypertrophy or pulmonary conditions. Recent studies emphasize that left deviation is associated with poorer clinical outcomes, with a cumulative 3-year incidence of major adverse cardiovascular events significantly greater in patients with LAD compared to those with a normal orientation. This association highlights the need for accurate ECG analysis to improve patient outcomes.
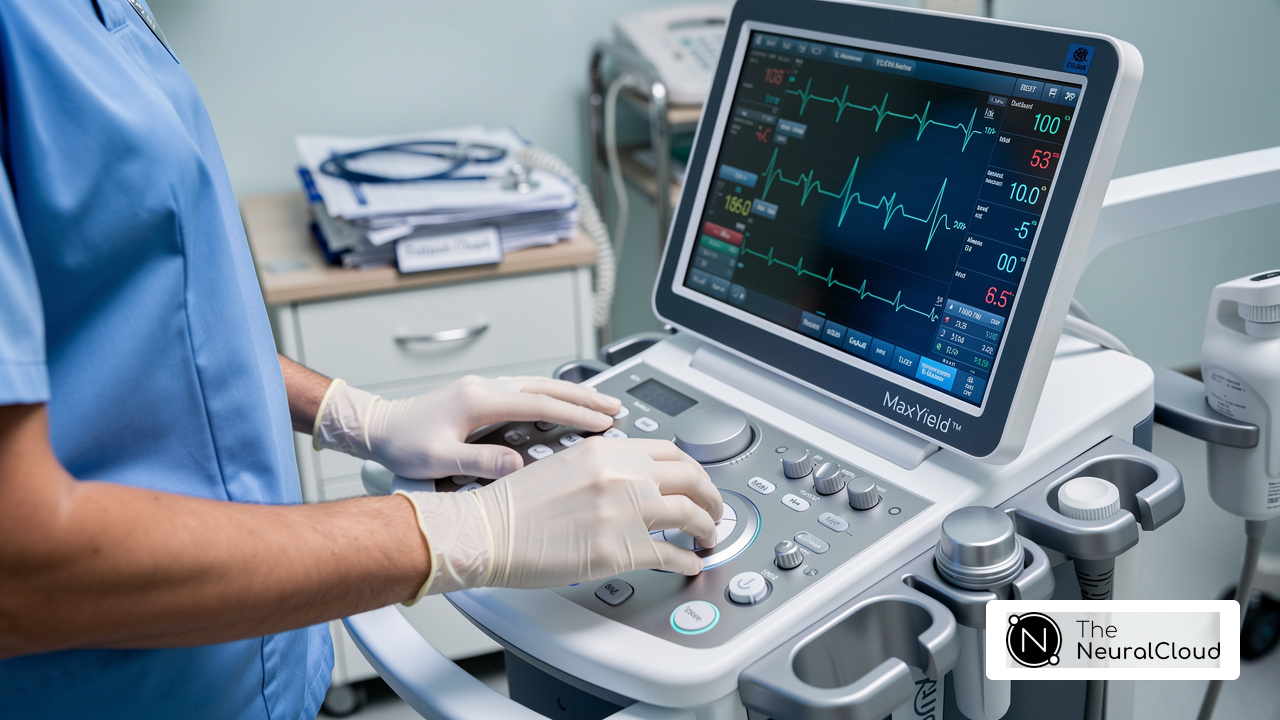
For health tech developers, integrating these insights into ECG analysis algorithms is vital for enhancing diagnostic accuracy and improving patient outcomes. Comprehending the electrical orientation is essential for progressing technologies that automate ECG analysis, ensuring that algorithms can adjust to different clinical situations. MaxYield™ features advanced noise filtering capabilities that enhance diagnostic accuracy in ECG analysis. This technology transforms noisy recordings into clear, detailed insights. MaxYield™ automates the identification of P-wave, QRS complex, and T-wave features, providing a clean, 'neuralized' signal that supports confident clinical decisions. These insights help developers tackle physiological variability and signal artifacts in ECG analysis algorithms more effectively. By integrating these insights, developers can significantly enhance the reliability of ECG analysis, ultimately benefiting patient health.
Gather Necessary Tools and Resources for Chart Creation
Before creating a heart axis chart, it's essential to gather the right tools and resources to ensure accuracy and reliability:
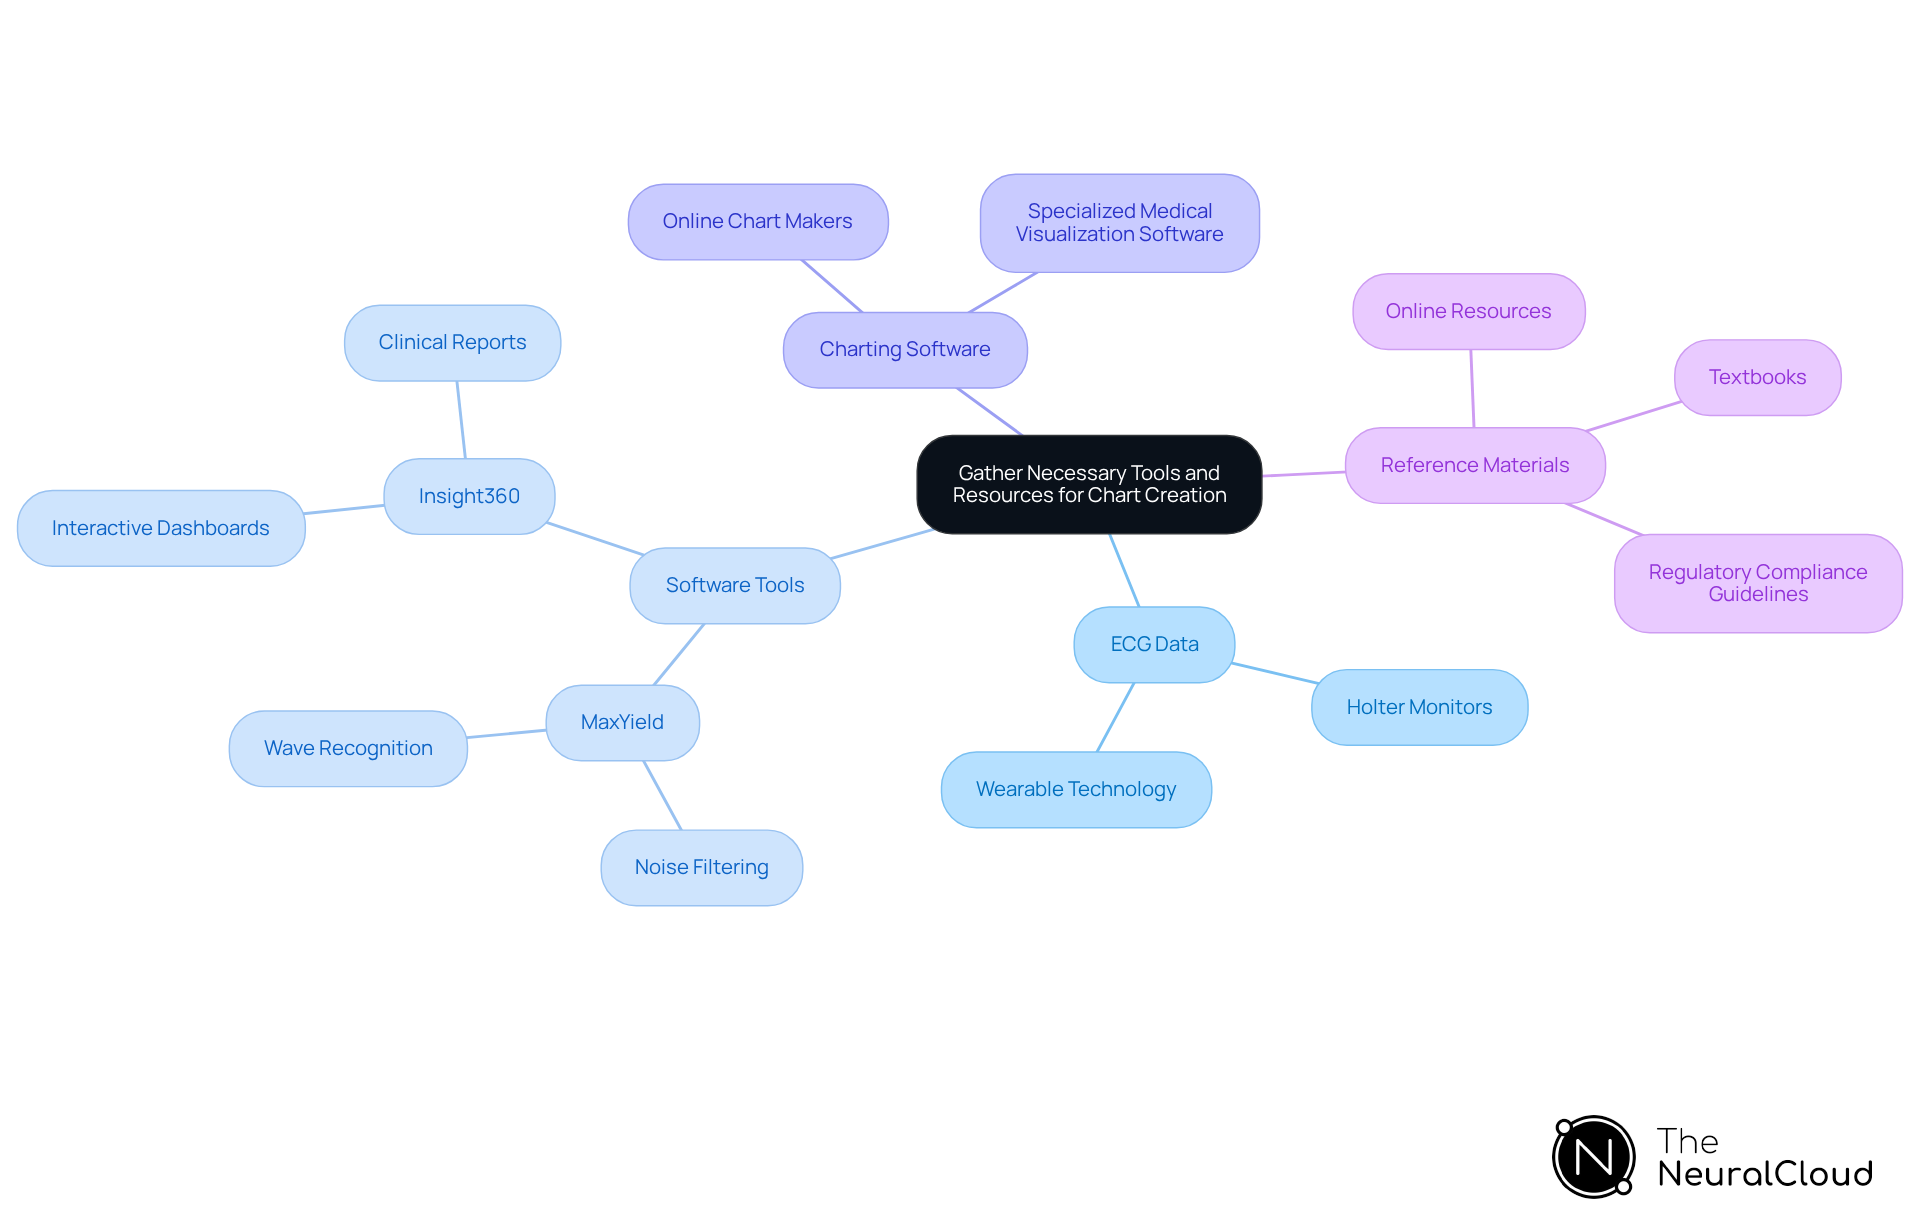
- ECG Data: Ensure access to high-quality ECG recordings, which can be sourced from Holter monitors and wearable technology. These devices have become increasingly popular, with studies showing that nearly 75% of healthcare companies invested in big information solutions by 2021, highlighting the growing reliance on advanced ECG data collection methods.
- Software Tools: Utilize software that supports ECG analysis and visualization. Tools like MaxYield are instrumental in processing raw ECG data and generating structured outputs, enhancing the accuracy of your analysis by isolating and cleaning noisy signals. MaxYield's advanced noise filtering and wave recognition capabilities provide consistent, clean information across all connected devices, which is crucial for reliable heart axis chart calculations. Additionally, consider using Insight360, a customizable tool that transforms MaxYield’s clean ECG data into interactive dashboards and clinical-ready reports.
- Charting Software: Choose a charting tool that allows for customization and flexibility. Options include online chart makers or specialized medical data visualization software that can adapt to your specific needs.
- Reference Materials: Keep reference materials accessible, such as textbooks or online resources that clarify cardiac orientation calculations and interpretations. Thorough manuals on cardiac orientation calculations can offer valuable insights and improve your comprehension of the topic. Furthermore, ensure that your processes align with regulatory compliance standards, including FDA Class II SaMD clearance-pending status, to meet the expectations of health tech developers.
By equipping yourself with these resources, you can significantly enhance the precision of your ECG analyses and ultimately improve patient care.
Follow Step-by-Step Instructions to Create the Heart Axis Chart
Accurate ECG analysis is crucial for effective cardiac care, yet many healthcare professionals face challenges in achieving reliable results. To create a heart axis chart using Neural Cloud Solutions' MaxYield platform, follow these steps:
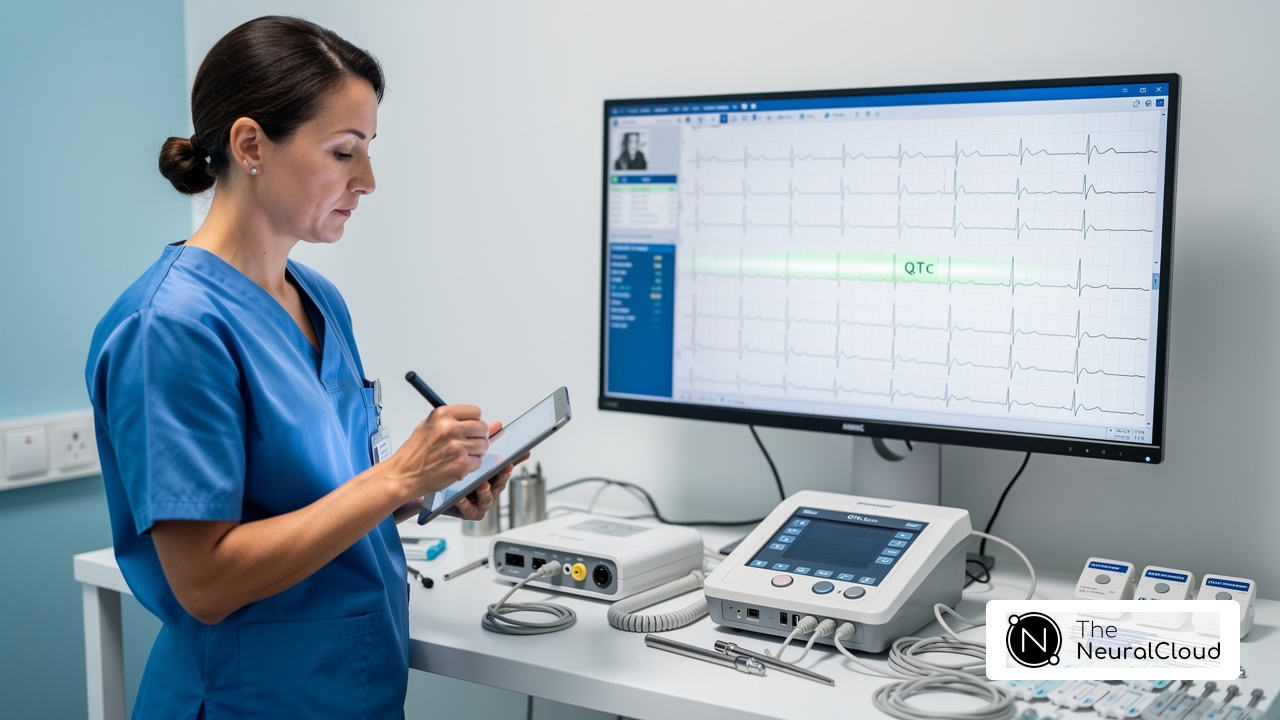
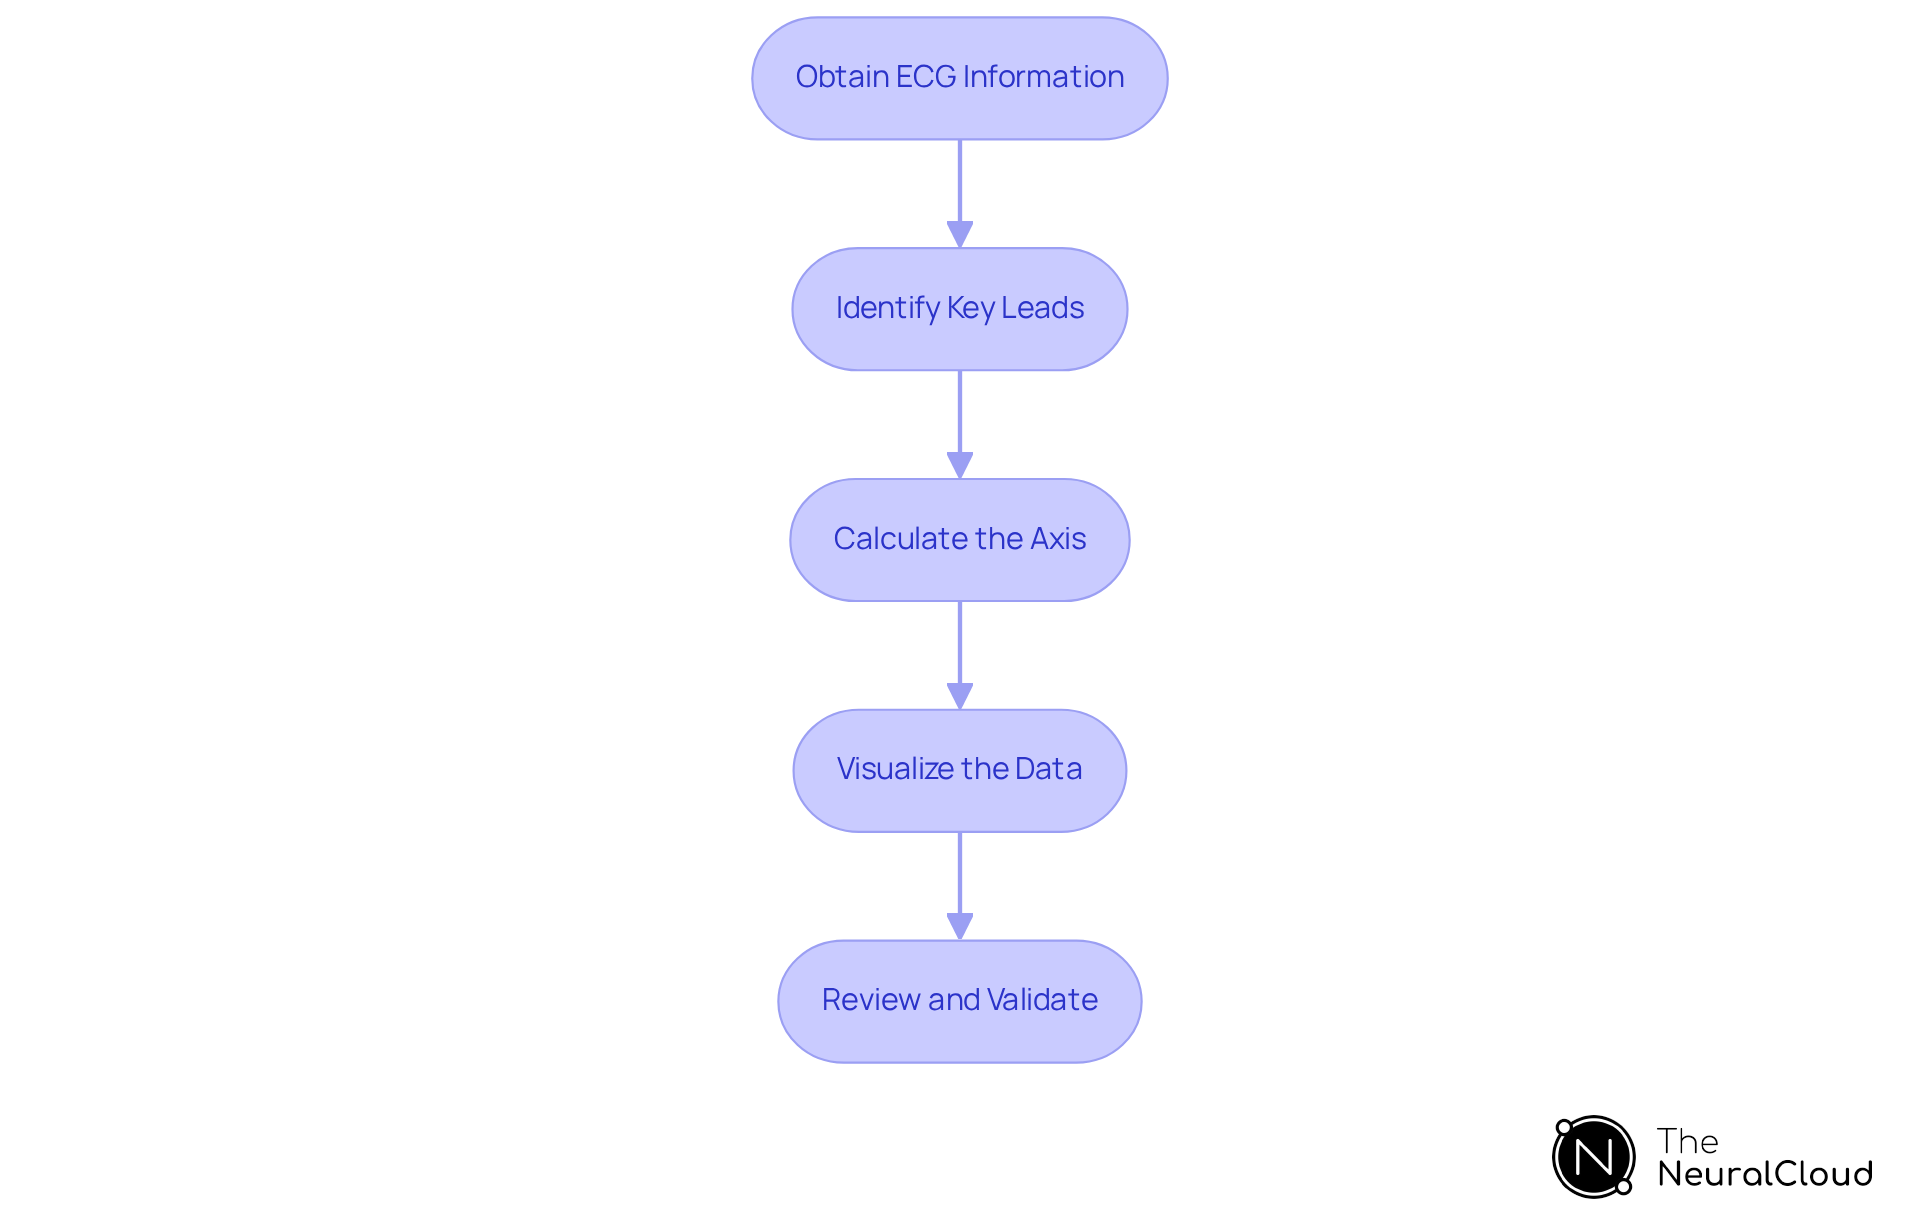
- Obtain ECG Information: Start by gathering the ECG information necessary for analysis. Ensure the information is clean and free from artifacts to enhance accuracy. MaxYield’s advanced noise filtering capabilities help isolate critical data, even in recordings with high levels of noise and artifact.
- Identify Key Leads: Concentrate on leads I and aVF to ascertain the cardiac orientation. Analyze the QRS complexes in these leads, noting their positivity or negativity. The typical cardiac orientation ranges from -30 degrees to +90 degrees, while deviations can indicate underlying conditions.
- Calculate the Axis: Utilize the hexaxial reference system to plot the net deflection of the QRS complex from leads I and aVF. Draw perpendicular lines from each lead's net deflection point to find the intersection, which indicates the direction on the heart axis chart. Right Axis Deviation (RAD) occurs when the orientation exceeds +90 degrees, observed in up to 15% of individuals with chronic lung disease. Conversely, Left Axis Deviation (LAD) is characterized as an angle less than -30 degrees, seen in about 20% of individuals with notable cardiac conditions.
- Visualize the Data: Input the computed coordinate into your charting software. Adjust the chart to clearly show the heart dimension, ensuring it is easy to interpret. Using Insight360, MaxYield’s clean ECG data can be turned into interactive dashboards and clinical-ready reports. This helps identify potential cardiac dysfunction, as deviations may indicate serious issues. As noted by cardiologists, 'The EKG orientation serves as a subtle yet critical indicator of potential cardiac dysfunction.'
- Review and Validate: Make sure to double-check your chart with established standards to confirm its accuracy. Utilize specific case studies that highlight the connection between alignment deviations and conditions like left ventricular hypertrophy or right bundle branch blocks for additional guidance. Understanding these relationships can significantly improve diagnostic capabilities and patient outcomes. For a personalized walkthrough of MaxYield and Insight360, feel free to contact Neural Cloud Solutions Inc. Embracing MaxYield not only streamlines ECG analysis but also empowers healthcare professionals to make informed decisions that can save lives.
Troubleshoot Common Issues in Heart Axis Chart Creation
Troubleshooting common issues in the creation of a heart axis chart is essential for accurate ECG analysis. Here’s how to address several frequent challenges effectively:
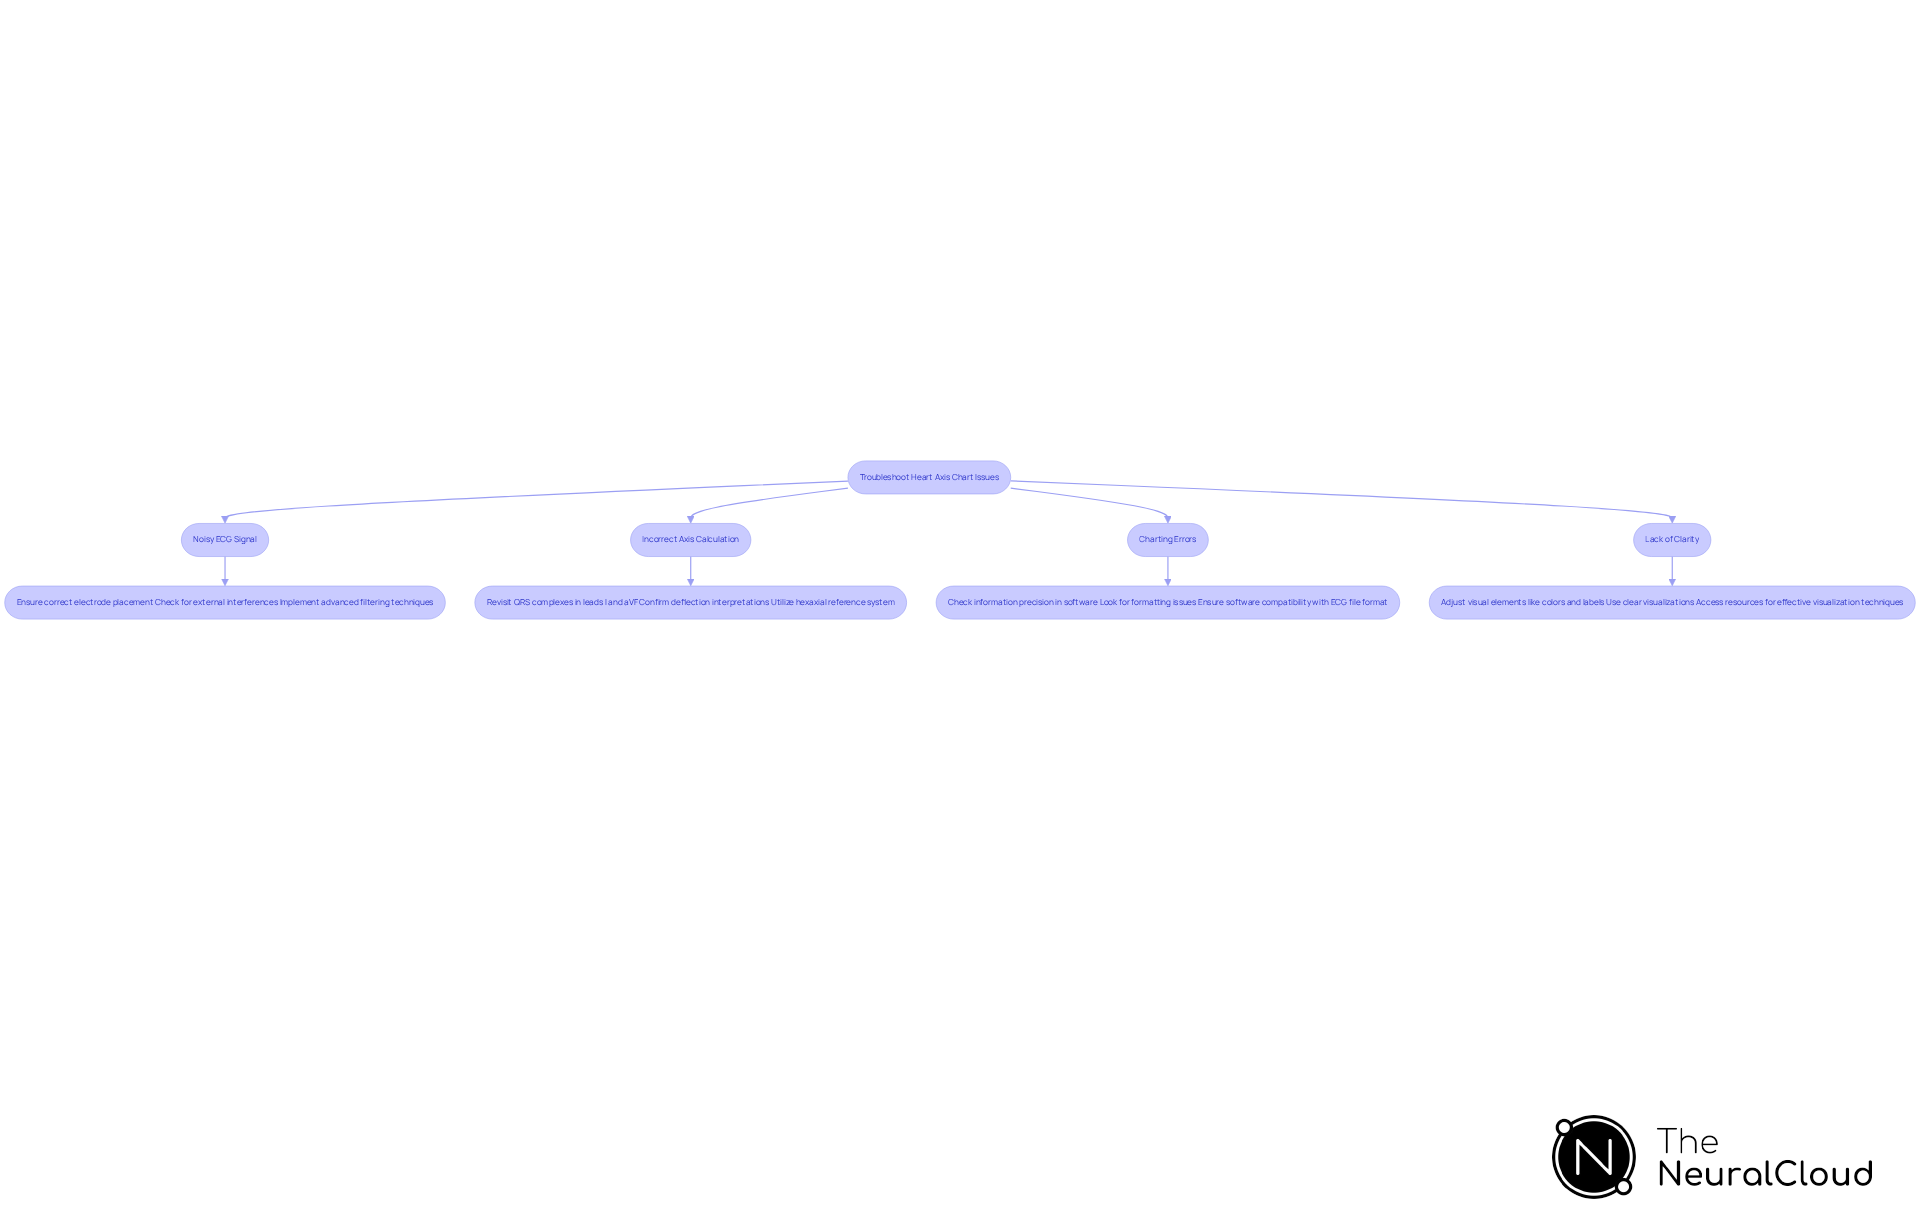
- Noisy ECG Signal: Noisy ECG information can significantly hinder accurate analysis. Ensure that electrodes are correctly placed and check for external interferences, such as electromagnetic noise from nearby equipment. Implementing advanced filtering techniques, like power-line filters, can help eliminate 50/60Hz interference, a common source of noise in clinical settings. The MaxYield™ platform from Neural Cloud Solutions provides advanced noise filtering features that return a clean, 'neuralized' signal, ensuring reliable ECG information. Research indicates that poor skin preparation and low-quality cables worsen noise issues. Therefore, using high-quality, CE-certified medical cables is essential for maintaining signal integrity.
- Incorrect Axis Calculation: If the calculated axis appears inaccurate, revisit the QRS complexes in leads I and aVF. Confirm that you are interpreting the deflections correctly and utilizing the hexaxial reference system accurately. Misinterpretations can lead to significant diagnostic errors, as studies indicate that nearly 39% of ECGs are misread. This emphasizes the importance of precise calculations and adherence to standardized protocols, which can be supported by the automated labeling features of MaxYield™.
- Charting Errors: If the chart does not display properly, check the precision of the information entered into the charting software. Look for formatting issues or incorrect parameters that could distort the visual representation. Ensuring that the software is compatible with the ECG file format is essential for precise charting. Additionally, integrating advanced ECG solutions like MaxYield™ can streamline workflows and enhance diagnostic capabilities, as demonstrated in successful case studies.
- Lack of Clarity: If the chart isn’t clear, tweak visual elements like colors, labels, and scales to make it easier to read. Using clear visualizations is key because how we communicate cardiac information can really affect clinical decisions. Resources that clarify cardiac orientation and deviations are accessible and can offer further insights into effective visualization techniques. Furthermore, the Insight360 tool transforms MaxYield’s clean ECG data into interactive dashboards and clinical-ready reports, enhancing clarity and usability.
By addressing these common issues with targeted solutions, health tech developers can enhance patient care by improving the accuracy and reliability of heart axis charts. Improving ECG analysis through effective troubleshooting not only enhances diagnostic accuracy but also significantly impacts patient care outcomes. For more information on how MaxYield™ and Insight360 can support your ECG analysis needs, contact Neural Cloud Solutions for free trials or personalized walkthroughs.
Conclusion
Creating accurate heart axis charts is a complex task that poses significant challenges for health tech developers aiming to enhance ECG analysis and improve patient outcomes. This guide has outlined the critical steps and resources necessary for accurate chart creation, emphasizing the importance of precise data interpretation and the integration of advanced technologies like MaxYield™ and Insight360.
Key insights discussed include:
- The significance of understanding cardiac orientation
- The necessity of high-quality ECG data
- The tools required for effective charting
By following the step-by-step instructions provided, developers can navigate common challenges, such as the complexities of ECG data interpretation, and ensure that their heart axis charts are both accurate and informative. It's important to recognize just how crucial advanced noise filtering and visualization tools are in this process, as they play a vital role in transforming raw ECG data into actionable insights.
Ultimately, creating reliable heart axis charts not only boosts diagnostic accuracy but also has a profound effect on patient care. Health tech developers are encouraged to leverage the resources and technologies available to them, ensuring that they remain at the forefront of ECG analysis innovation. By embracing these advanced tools and methodologies, developers can not only elevate their ECG analysis capabilities but also play a pivotal role in shaping the future of patient care.
Frequently Asked Questions
What is the significance of understanding heart axis in ECG interpretation?
Understanding heart axis is crucial for accurate ECG analysis and effective patient care, as it indicates the overall direction of electrical activity during depolarization.
What is the typical range for heart axis orientation?
The typical range for heart axis orientation is from -30° to +90°.
Which ECG leads are essential for determining heart orientation?
The QRS complex in leads I and aVF is essential for determining heart orientation.
What is left axis deviation (LAD) and what conditions is it associated with?
Left axis deviation (LAD) occurs when the heart orientation shifts to the left of -30° and is often linked with conditions such as left ventricular hypertrophy, inferior myocardial infarction, and aortic stenosis.
Why can diagnosing conditions associated with left axis deviation be challenging?
Diagnosing conditions associated with left axis deviation can be challenging due to overlapping symptoms.
What is right axis deviation (RAD) and what does it suggest?
Right axis deviation (RAD) occurs when the heart orientation shifts to the right of +90° and can suggest right ventricular hypertrophy or pulmonary conditions.
What recent findings have been made regarding left axis deviation and clinical outcomes?
Recent studies emphasize that left axis deviation is associated with poorer clinical outcomes, with a significantly greater cumulative 3-year incidence of major adverse cardiovascular events in patients with LAD compared to those with a normal orientation.
How can health tech developers utilize insights from heart axis analysis?
Health tech developers can integrate insights from heart axis analysis into ECG analysis algorithms to enhance diagnostic accuracy and improve patient outcomes.
What features does MaxYield™ offer to improve ECG analysis?
MaxYield™ features advanced noise filtering capabilities that enhance diagnostic accuracy by transforming noisy recordings into clear, detailed insights and automating the identification of P-wave, QRS complex, and T-wave features.
How does MaxYield™ support clinical decision-making?
By providing a clean, 'neuralized' signal, MaxYield™ supports confident clinical decisions and helps developers tackle physiological variability and signal artifacts in ECG analysis algorithms.
List of Sources
- Understand the Basics of Heart Axis and ECG Interpretation
- theneuralcloud.com (https://theneuralcloud.com/post/master-ecg-axis-deviation-key-insights-for-health-tech-developers)
- Clinical impact of left and right axis deviations with narrow QRS complex on 3-year outcomes in a hospital-based population in Japan - Scientific Reports (https://nature.com/articles/s41598-021-88259-8)
- Electrical Right and Left Axis Deviation - StatPearls - NCBI Bookshelf (https://ncbi.nlm.nih.gov/books/NBK470532)
- Researchers unlock hidden geometry of the heart to revolutionise ECG interpretation | King's College London (https://kcl.ac.uk/news/researchers-unlock-hidden-geometry-of-the-heart-to-revolutionise-ecg-interpretation)
- Gather Necessary Tools and Resources for Chart Creation
- MedTech Breakthrough Names AI-powered Hyperkalemia Detection Software 'Best New ECG Technology Solution' (https://dicardiology.com/content/medtech-breakthrough-names-ai-powered-hyperkalemia-detection-software-best-new-ecg)
- AI-ECG Momentum and Rising Competition Reshape Diagnostic Cardiology in 2026 (https://signifyresearch.net/insights/diagnostic-cardiology-market-bouncing-into-2026)
- AI-Powered ECG Analysis Offers Promising Path for Early Detection of Chronic Obstructive Pulmonary Disease, Say Mount Sinai Researchers (https://mountsinai.org/about/newsroom/2026/ai-powered-ecg-analysis-offers-promising-path-for-early-detection-of-chronic-obstructive-pulmonary-disease-say-mount-sinai-researchers)
- ECG market keeps evolving thanks to AI, home monitoring and Epic integration (https://cardiovascularbusiness.com/topics/cardiac-imaging/electrocardiography-ecg/ecg-market-keeps-evolving-thanks-ai-home-monitoring-and-epic-integration)
- FDA Clears AI-ECG Screening Tools for CV Care: What’s Next Is Up for Grabs (https://tctmd.com/news/fda-clears-ai-ecg-screening-tools-cv-care-whats-next-grabs)
- Follow Step-by-Step Instructions to Create the Heart Axis Chart
- ECG Axis Interpretation (https://litfl.com/ecg-axis-interpretation)
- Determining the cardiac axis—made super easy | Medmastery (https://medmastery.com/magazine/determining-cardiac-axismade-super-easy?srsltid=AfmBOop6lSoidffhiVjpJ8Ls39ff8Bus9rXepehaD9hwaTHFc7M3kdL8)
- theneuralcloud.com (https://theneuralcloud.com/post/master-ekg-axis-calculation-with-step-by-step-guidance)
- Troubleshoot Common Issues in Heart Axis Chart Creation
- A Guide to ECG Signal Filtering (https://gehealthcare.com/en-gb/insights/article/a-guide-to-ecg-signal-filtering?srsltid=AfmBOor-A4h1nKUXpvb6EU7LEbxFf4G5frc4i1KDPH3RYm1_AD02FklH)
- theneuralcloud.com (https://theneuralcloud.com/post/enhance-ecg-data-analysis-with-advanced-technologies-and-best-practices)
- ECG Signal Noise: Stop False Alarms and Diagnostic Errors | Elarix UK (https://selfimed.com/blogs/news/fix-ecg-signal-noise-false-alarms-guide?srsltid=AfmBOorPSvVR4rX2BN7FzFutVkzhvJeGNzWgwzGRiO_wslSmRu2DyriP)
- Frontiers | The most common errors in automatic ECG interpretation (https://frontiersin.org/journals/physiology/articles/10.3389/fphys.2025.1590170/full)
- Pulse Check: Cardiac care solutions aren’t keeping pace with a significant growth in need and ecosystem complexity - Heartkey (https://heartkey.io/resources/cardiac-care-solutions-arent-keeping-pace-with-a-significant-growth-in-need-and-ecosystem-complexity)