Introduction
Developers often struggle to accurately interpret heart rate data from ECGs, which is essential for effective cardiac monitoring tools. With the heart's electrical signals captured in the intricate patterns of an ECG, developers can gain insights that enhance patient care and diagnostic accuracy. Yet, mastering the various techniques and technologies necessary to transform raw data into actionable information presents a significant challenge for developers.
What advanced tools and methodologies can developers utilize to ensure precise heart rate calculations and enhance clinical outcomes?
Understand the Basics of ECG and Heart Rate Measurement
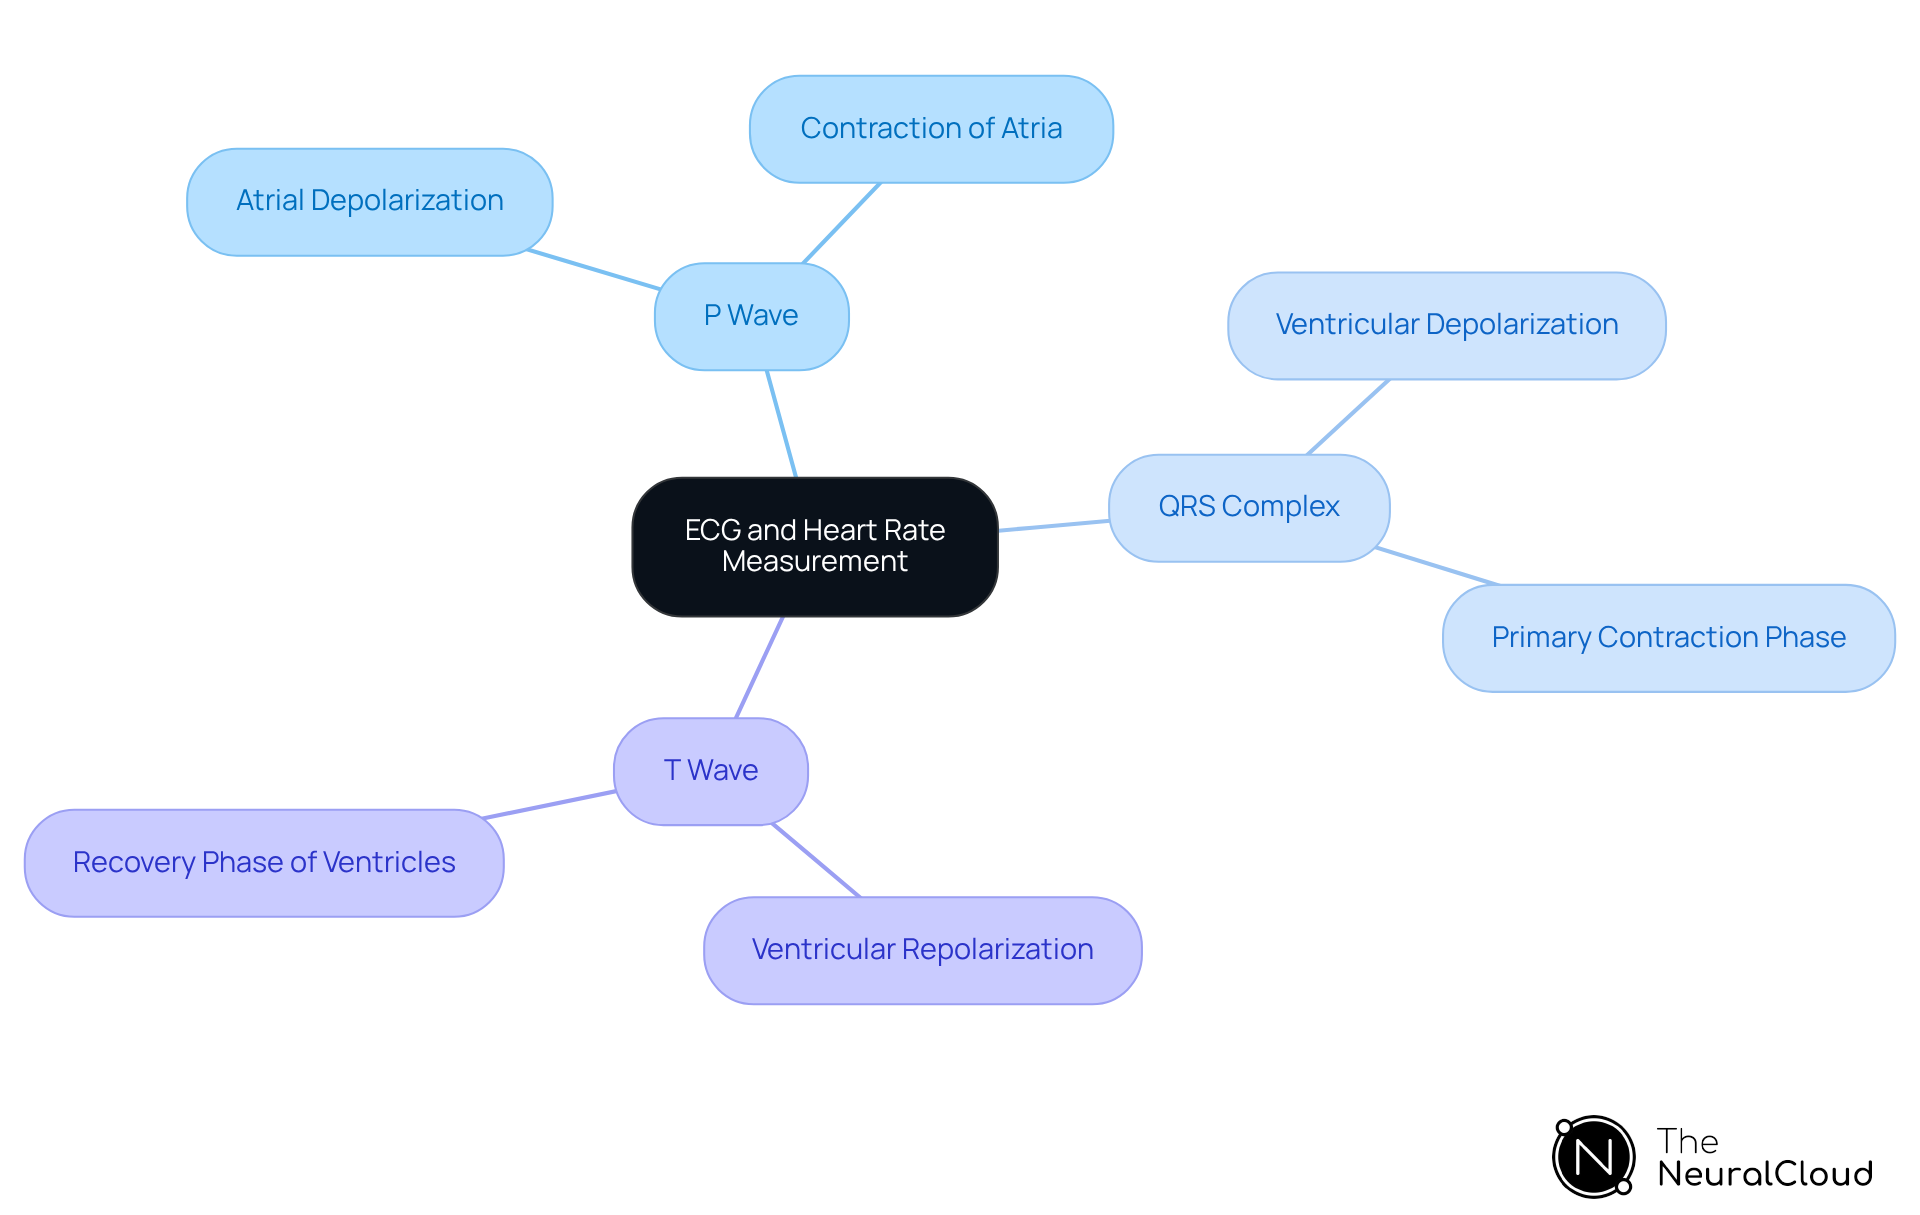
Understanding how to read heart rate on ECG is essential for accurate pulse rate readings and effective cardiac monitoring. An ECG captures the electrical signals produced by the heart during each beat, providing insights into its rhythm and function. The primary components of an ECG include the P wave, QRS complex, and T wave, each representing distinct phases of the heart's electrical cycle:
- P Wave: This signal signifies atrial depolarization, indicating the contraction of the atria, which is essential for effective blood flow into the ventricles.
- QRS Complex: This component reflects ventricular depolarization, marking the primary contraction phase of the heart, where blood is pumped out to the lungs and the rest of the body.
- T Wave: This signal represents ventricular repolarization, the recovery phase of the ventricles, preparing them for the next contraction.
To understand how to read heart rate on ECG, it is important to note that heart rate is typically measured in beats per minute (bpm) and can be derived from the intervals between these waves, particularly focusing on the R waves within the QRS complex. Grasping these basics is key for developers looking to build reliable ECG interpretation tools.
Recent advancements in ECG technology, especially in 2026, highlight how AI can boost diagnostic capabilities. For example, Neural Cloud Solutions' platform employs sophisticated algorithms to enhance the precision of pulse rate measurements and identify conditions that might be overlooked by conventional techniques. The system effectively maps ECG signals through noise, isolating and labeling key features in every heartbeat, transforming noisy recordings into detailed insights. A 2025 study highlighted that 39% of automatically interpreted ECGs contained errors, underscoring the need for improved algorithms that can better analyze cardiac activity.
The ECG intelligence layer is a versatile solution that integrates easily through API, SDK, or CDK, improving compatibility with various consumer devices. Additionally, the customizable visualization and reporting tool, Insight360, transforms MaxYield’s clean ECG data into interactive dashboards and clinical-ready reports, facilitating better decision-making.
Case studies, such as the validation of algorithms for identifying left ventricular systolic dysfunction, demonstrate the potential of advanced ECG analysis in proactive monitoring. These developments not only enhance the accuracy of heart rate measurements but also contribute to better patient outcomes by facilitating timely interventions. As the landscape of cardiac diagnostics evolves, knowing how to read heart rate on ECG becomes increasingly essential for developers in the health tech sector. By utilizing the advanced system, developers can ensure consistent, clean data across all connected devices, ultimately revolutionizing home patient monitoring with hospital-grade ECG accuracy from consumer devices. Exploring the capabilities of MaxYield™ could redefine how healthcare professionals approach ECG analysis and patient monitoring.
Calculate Heart Rate Using Different Methods
Understanding how to read heart rate on ECG can be challenging, especially when traditional methods fall short in accuracy. However, advanced platforms like Neural Cloud Solutions' MaxYield™ offer several effective methods tailored for specific scenarios:
-
R Wave Method: This approach entails counting the number of R peaks in a 10-second rhythm strip and multiplying by 6. It provides a rapid assessment of the pulse rate, which can be improved by MaxYield™'s automated labeling features.
- Example: If there are 10 R peaks in 10 seconds, the heart rate is 10 x 6 = 60 bpm.
-
Large Box Method: Count the number of large boxes between two R peaks and divide 300 by this number. This method is particularly effective for regular rhythms, and MaxYield™ can help ensure accurate readings by filtering out noise and artifacts.
- Example: If there are 3 large boxes between R peaks, the heart rate is 300 / 3 = 100 bpm.
-
Small Box Method: This technique involves counting the number of small boxes between two R peaks and dividing 1500 by this quantity. It is more precise for irregular rhythms, with MaxYield™ providing advanced noise reduction to enhance accuracy.
- Example: If there are 15 small boxes between R peaks, the heart rate is 1500 / 15 = 100 bpm.
-
Six-Second Method: Count the number of R peaks in a 6-second strip and multiply by 10. This method is useful for quick assessments, and the MaxYield™ platform can streamline this process by ensuring clean data.
- Example: If there are 5 R waves in 6 seconds, the pulse rate is 5 x 10 = 50 bpm.
These methods equip healthcare professionals with the tools they need to learn how to read heart rate on ECG for accurate pulse rate calculations in their practices. Notably, the MaxYield™ platform addresses physiological variability and signal artifacts, overcoming traditional limitations in ECG analysis. Additionally, Insight360 serves as a customizable visualization and reporting tool that transforms MaxYield’s clean ECG data into interactive dashboards and clinical-ready reports. Furthermore, it is important to note that Neural Cloud Solutions is currently pursuing FDA Class II SaMD clearance-pending status, ensuring compliance and enhancing the credibility of its offerings. By leveraging MaxYield™, healthcare professionals can enhance their ECG analysis, leading to better patient outcomes.

Evaluate Heart Rhythm and Identify Regularity
To evaluate heart rhythm and identify regularity, follow these essential steps:
- Identify the R-R Intervals: Measure the distance between consecutive R waves using a ruler or digital tools in ECG software. Regular rhythms will exhibit consistent R-R intervals, while irregular rhythms will display variability.
- Count the R-R Intervals: For a more precise evaluation, count the number of R-R intervals within a specific time frame (e.g., 10 seconds) and assess their consistency. This method is crucial, as studies indicate that understanding how to read heart rate on ECG can significantly impact clinical decisions.
- Determine Regularity: Classify the rhythm as regular (consistent intervals) or irregular (varying intervals). Common irregular rhythms include atrial fibrillation, which affects approximately 12 million people by 2030, and premature ventricular contractions, both of which require careful monitoring.
- Use Software Tools: Use algorithms that automatically detect and classify rhythm regularity by analyzing R-R intervals. This technological integration enhances the accuracy of ECG interpretation tools, aligning with advancements in cardiovascular medicine promoted by organizations like the Heart Rhythm Society.
- Review Case Studies: Analyze real-world examples, such as cardiac catheter ablation, which effectively restores normal heart rhythm by blocking irregular signals. These cases offer valuable insights into how rhythm evaluation is applied in practice.
Accurate rhythm evaluation is critical, yet many face challenges in achieving consistency. By mastering how to read heart rate on ECG, healthcare professionals can significantly improve patient care.

Analyze Key Components of the ECG Waveform
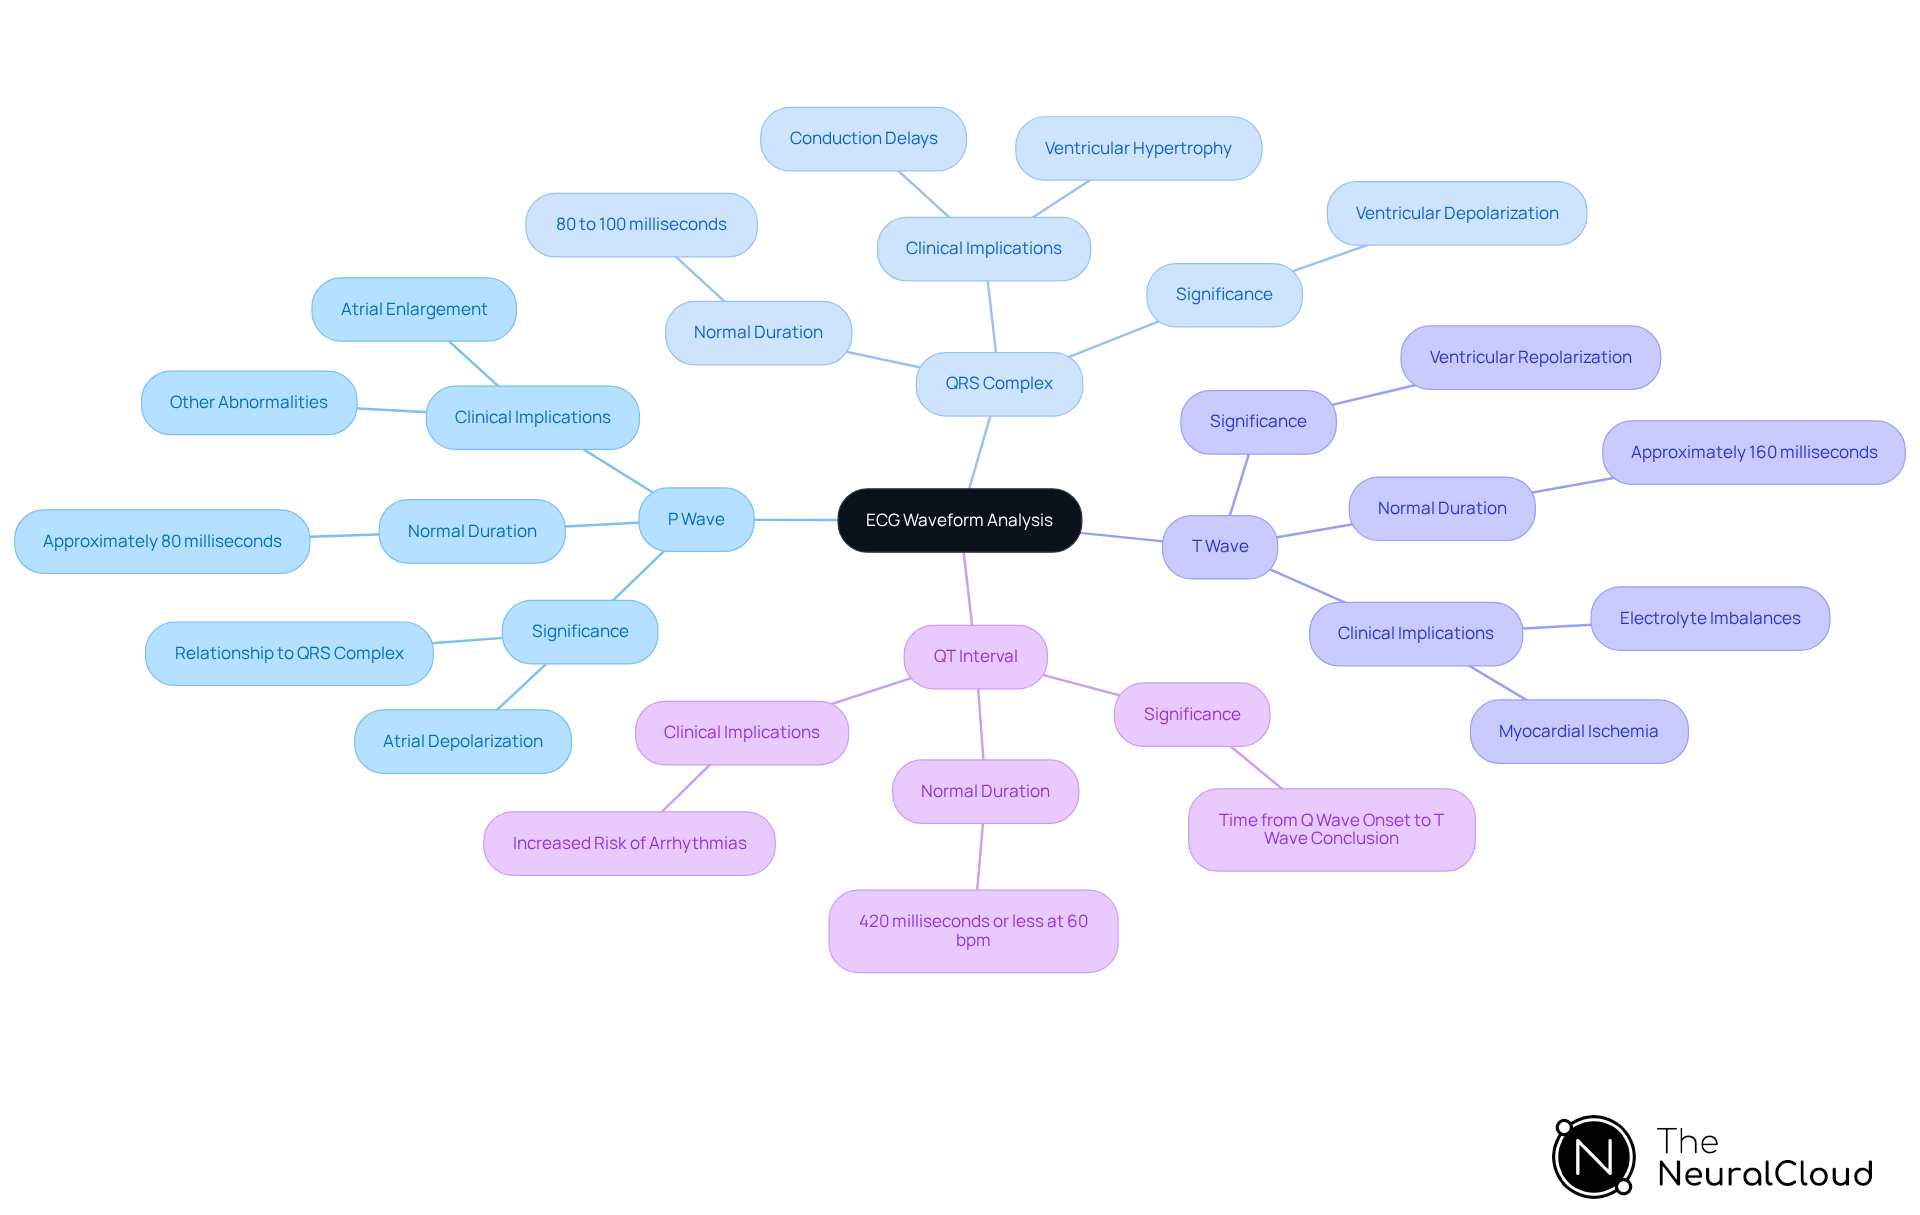
Healthcare professionals often face challenges in accurately interpreting how to read heart rate on ECG waveforms, which are crucial for assessing cardiac function. The ECG waveform includes key components that provide vital insights into cardiac function. The MaxYield™ platform from Neural Cloud Solutions significantly enhances these insights:
- P Wave: This component signifies atrial depolarization. Its shape, duration (normal duration is approximately 80 milliseconds), and amplitude are vital for evaluating atrial health. A normal P signal appears smooth and rounded, while deviations may indicate conditions such as atrial enlargement or other abnormalities. In learning how to read heart rate on ECG, the relationship of P waves to QRS complexes is crucial, as it helps assess the overall cardiac rhythm. The system aids in accurately labeling these features, ensuring that clinicians can make informed decisions based on clear data.
- QRS Complex: Representing ventricular depolarization, the QRS complex is paramount for assessing heart function. Analyzing its duration, which normally ranges from 80 to 100 milliseconds, and its morphology is crucial. A prolonged QRS duration may indicate conduction delays or ventricular hypertrophy, both of which have significant clinical implications. The automated analysis capabilities of the system enable swift processing of these components, providing insights that facilitate prompt clinical interventions. Notably, MaxYield™ can analyze 200,000 heartbeats in less than 5 minutes, enhancing efficiency in clinical settings.
- T Wave: This signal indicates ventricular repolarization. Its shape and direction are critical for identifying ischemia or electrolyte imbalances. For example, inverted T patterns can be indicative of myocardial ischemia, while tall T patterns may signal hyperkalemia, necessitating further investigation. The normal T duration is usually about 160 milliseconds. With MaxYield™, healthcare professionals can see these patterns clearly, improving diagnostic precision.
- QT Interval: This interval measures the time from the onset of the Q wave to the conclusion of the T wave. A prolonged QT interval (normal is 420 milliseconds or less at 60 bpm) is associated with an increased risk of arrhythmias, making accurate measurement essential. Utilizing advanced algorithms can enhance the precision of these interval assessments, thereby improving diagnostic accuracy.
By thoroughly analyzing these components with the assistance of an advanced tool, developers can design applications that provide comprehensive insights into cardiac health, ultimately enhancing patient outcomes and supporting clinical decision-making. The platform transforms noisy recordings into clear insights, ensuring visibility of P and T waves, which is essential for effective ECG analysis and understanding how to read heart rate on ECG accurately. Additionally, integrating Insight360 as a visualization tool can further enhance the presentation of ECG data, transforming clean ECG data into interactive dashboards and clinical-ready reports. By leveraging the MaxYield™ platform, healthcare professionals can enhance their diagnostic capabilities, ultimately leading to better patient care and outcomes.
Utilize Advanced Tools for Enhanced ECG Interpretation
Traditional ECG analysis often struggles to identify subtle patterns, leading to potential misdiagnoses. To enhance ECG interpretation, developers should consider integrating advanced tools and technologies:
- AI and Machine Learning: Implement algorithms capable of real-time analysis of ECG data, identifying patterns and anomalies that traditional methods may overlook. AI can be trained to recognize specific arrhythmias and other cardiac conditions based on extensive historical data, significantly improving diagnostic accuracy. Dr. Ng highlights the importance of ensuring that tools integrate smoothly into existing workflows, minimizing friction at the point of care.
- Automated Analysis Software: Next, consider automated analysis software that detects and reports key ECG features, such as PQRST onset, amplitude, and intervals. This automation not only saves time but also minimizes human error in ECG interpretation, leading to more reliable outcomes. The system delivers beat-by-beat analysis, outputting insights from 200,000 heartbeats in less than 5 minutes, showcasing its efficiency. A deep neural network (DNN) has shown an accuracy of 85.7% in diagnosing left ventricular systolic dysfunction (LVSD), highlighting the potential of automated analysis. Additionally, this product is designed to comply with FDA Class II SaMD clearance-pending status, ensuring regulatory adherence.
- Visualization Tools: To enhance data interpretation, Insight360 offers a customizable visualization and reporting tool that transforms clean ECG data from the system into interactive dashboards and clinical-ready reports. Such tools facilitate monitoring of patient progress and early identification of potential issues. Customizable dashboards can enhance user experience and support informed decision-making, as noted in the practical adoption checklist for AI-ECG tools, which emphasizes the importance of clinical utility and real-world impact.
- Integration with Existing Systems: Ensure that ECG interpretation tools can seamlessly integrate with existing healthcare systems and workflows. This enhances usability and promotes adoption, achievable through APIs and standardized data formats. Addressing the challenges of effective integration, Dr. Elias states, "Clinicians are looking for AI to be good enough so they can rely on it and put it into practice." This seamless integration not only boosts clinician confidence but also enhances patient care through timely and accurate diagnostics.
By leveraging these advanced tools, developers can create robust ECG interpretation applications that not only improve diagnostic accuracy but also enhance patient outcomes. For personalized walkthroughs of MaxYield™ and Insight360, consider contacting Neural Cloud Solutions Inc. for free trials.

Conclusion
For developers in health tech, accurately reading heart rate on ECG is essential for effective cardiac monitoring. By mastering ECG waveforms can be challenging without the right tools, developers can significantly enhance the reliability of heart rate measurements and improve clinical outcomes.
The article outlined essential steps for reading heart rate on ECG, including recognizing key components such as the P wave, QRS complex, and T wave, as well as various methods for calculating heart rate. It emphasized the importance of utilizing advanced platforms like Neural Cloud Solutions' MaxYield™ and Insight360, which offer automated analysis and visualization tools that streamline ECG interpretation. These innovations not only reduce the likelihood of errors but also empower healthcare professionals to make informed decisions based on clear, actionable data.
As cardiac diagnostics evolve, it's important for developers to keep pace with these advanced technologies. By leveraging the capabilities of MaxYield™ and Insight360, healthcare professionals can ensure accurate heart rate readings and enhance patient monitoring, ultimately leading to better health outcomes. The integration of AI and machine learning into ECG interpretation tools represents a significant step forward in the quest for precision in cardiac care, making it imperative for developers to stay informed and engaged with these advancements.
Frequently Asked Questions
What is an ECG and why is it important for heart rate measurement?
An ECG (electrocardiogram) captures the electrical signals produced by the heart during each beat, providing insights into its rhythm and function. Understanding how to read heart rate on ECG is essential for accurate pulse rate readings and effective cardiac monitoring.
What are the main components of an ECG?
The primary components of an ECG include:
- P Wave: Signifies atrial depolarization, indicating the contraction of the atria.
- QRS Complex: Reflects ventricular depolarization, marking the primary contraction phase of the heart.
- T Wave: Represents ventricular repolarization, the recovery phase of the ventricles.
How is heart rate measured using an ECG?
Heart rate is typically measured in beats per minute (bpm) and can be derived from the intervals between the waves, particularly focusing on the R waves within the QRS complex.
What advancements in ECG technology have been made recently?
Recent advancements, particularly in 2026, highlight how AI can enhance diagnostic capabilities. For example, Neural Cloud Solutions' platform uses sophisticated algorithms to improve pulse rate measurements and identify conditions that may be overlooked by conventional techniques.
What methods can be used to calculate heart rate using an ECG?
Several methods include:
- R Wave Method: Count R peaks in a 10-second strip and multiply by 6.
- Large Box Method: Count large boxes between R peaks and divide 300 by this number.
- Small Box Method: Count small boxes between R peaks and divide 1500 by this quantity.
- Six-Second Method: Count R peaks in a 6-second strip and multiply by 10.
How does the MaxYield™ platform enhance ECG analysis?
The MaxYield™ platform improves ECG analysis by providing automated labeling features, filtering out noise and artifacts, and ensuring clean data for accurate readings. It also addresses physiological variability and signal artifacts, enhancing the reliability of heart rate calculations.
What is Insight360 and how does it relate to ECG data?
Insight360 is a customizable visualization and reporting tool that transforms clean ECG data from MaxYield™ into interactive dashboards and clinical-ready reports, facilitating better decision-making for healthcare professionals.
What is the significance of the FDA Class II SaMD clearance-pending status for Neural Cloud Solutions?
The FDA Class II SaMD clearance-pending status indicates that Neural Cloud Solutions is ensuring compliance with regulatory standards, which enhances the credibility of its offerings in the healthcare market.
List of Sources
- Understand the Basics of ECG and Heart Rate Measurement
- HeartBeam Earns FDA Clearance for 12-Lead Synthesis Software for Assessing Arrhythmia (https://dicardiology.com/content/heartbeam-earns-fda-clearance-12-lead-synthesis-software-assessing-arrhythmia)
- AI and ECG Interpretation: The next era of cardiology starts here (https://clinicalview.gehealthcare.com/article/ai-and-ecg-interpretation-next-era-cardiology-starts-here)
- AI-ECG Momentum and Rising Competition Reshape Diagnostic Cardiology in 2026 (https://signifyresearch.net/insights/diagnostic-cardiology-market-bouncing-into-2026)
- ECG market keeps evolving thanks to AI, home monitoring and Epic integration (https://cardiovascularbusiness.com/topics/cardiac-imaging/electrocardiography-ecg/ecg-market-keeps-evolving-thanks-ai-home-monitoring-and-epic-integration)
- AccurKardia (https://accurkardia.com/news)
- Calculate Heart Rate Using Different Methods
- ECG Rate Interpretation (https://litfl.com/ecg-rate-interpretation)
- Study Shows Promising Results for ECG Technology (https://dicardiology.com/content/study-shows-promising-results-ecg-technology)
- With AI, researchers discover new way to detect sudden cardiac death risk - Berkeley News (https://news.berkeley.edu/2026/06/24/with-ai-researchers-discover-new-way-to-detect-sudden-cardiac-death-risk)
- CV Physiology | Determining Heart Rate from the Electrocardiogram (https://cvphysiology.com/arrhythmias/a020)
- ECG Heart Rate Calculator | R-R Interval, QTc, ECG Boxes & Rhythm Analysis (https://pearson.com/channels/calculators/ecg-heart-rate-calculator)
- Evaluate Heart Rhythm and Identify Regularity
- Global surge in serious heart rhythm disorders sparks urgent call to action from experts: 1 in 3 people at risk (https://escardio.org/news/press/press-releases/global-surge-in-serious-heart-rhythm-disorders-sparks-urgent-call-to-action-from)
- New Clinical Trial Finds Human Oversight ECG Monitors Outperform AI-Dependent Monitoring - HRS (https://hrsonline.org/news/human-oversight-ecg-monitors-outperform-ai-dependent-monitoring)
- New therapeutic target for cardiac arrhythmias emerges (https://healthsciences.arizona.edu/news/releases/new-therapeutic-target-cardiac-arrhythmias-emerges)
- HeartBeam Announces New Peer-Reviewed Article Demonstrating Potential to Help Identify Heart Attack Risk at Home (https://ir.heartbeam.com/news-events/press-releases/detail/123/heartbeam-announces-new-peer-reviewed-article-demonstrating)
- Heart arrhythmia - Diagnosis and treatment - Mayo Clinic (https://mayoclinic.org/diseases-conditions/heart-arrhythmia/diagnosis-treatment/drc-20350674)
- Analyze Key Components of the ECG Waveform
- 6 Trends In ECG Systems (https://dicardiology.com/article/6-trends-ecg-systems)
- Normal Electrocardiography (ECG) Intervals: Normal Electrocardiography Intervals (https://emedicine.medscape.com/article/2172196-overview)
- Statistical and spectral analysis of ECG signal towards achieving non-invasive blood glucose monitoring - PMC (https://pmc.ncbi.nlm.nih.gov/articles/PMC6921435)
- About ECG waveform analysis - Kubios HRV (https://kubios.com/blog/about-ecg-waveform-analysis)
- Utilize Advanced Tools for Enhanced ECG Interpretation
- AI and ECG Interpretation: The next era of cardiology starts here (https://clinicalview.gehealthcare.com/article/ai-and-ecg-interpretation-next-era-cardiology-starts-here)
- New AI approach set to revolutionize ECG data interpretation in heart disease diagnosis (https://news-medical.net/news/20250219/New-AI-approach-set-to-revolutionize-ECG-data-interpretation-in-heart-disease-diagnosis.aspx)
- AI and ECG Interpretation: Insights and Trends for Cardiologists (https://gehealthcare.com/en/insights/article/ai-and-ecg-interpretation-insights-and-trends-for-todays-cardiologists?srsltid=AfmBOopoYqiU3JSYM2gVWzOnRXt26-eP_aTKsczs0bylQuodsSrEvLWC)
- AI-based ECG interpretation outperforms standard diagnosis of occlusive myocardial infarction (https://news-medical.net/news/20260323/AI-based-ECG-interpretation-outperforms-standard-diagnosis-of-occlusive-myocardial-infarction.aspx)