Introduction
Many clinicians find ECG axis interpretation challenging, leading to potential misdiagnoses. This article delves into advanced diagram techniques that clarify the concept of ECG axis and enhance diagnostic precision through visual aids. Mastering these techniques can significantly enhance diagnostic accuracy and improve patient outcomes.
Define ECG Axis and Its Clinical Importance
Understanding the ECG axis diagram is vital for accurate cardiac assessment. The ECG orientation, represented in the ECG axis diagram, indicates the overall direction of electrical activity during heart depolarization, measured in degrees and visualized on a hexaxial reference system. The normal QRS orientation typically ranges from -30° to +90°. Grasping this dimension is essential for identifying different cardiac conditions, as variations can indicate underlying problems like hypertrophy or conduction blocks. For example, a left orientation shift (LAD) occurs between -30° and -90° and is frequently linked to left ventricular hypertrophy and inferior myocardial infarction. In contrast, a right orientation shift (RAD) spans from +90° to +180° and may suggest right ventricular hypertrophy or pulmonary issues. Recent studies have indicated that variations in cardiac orientation can significantly influence clinical outcomes, with patients exhibiting LAD facing a higher risk of all-cause mortality compared to those with a normal orientation.
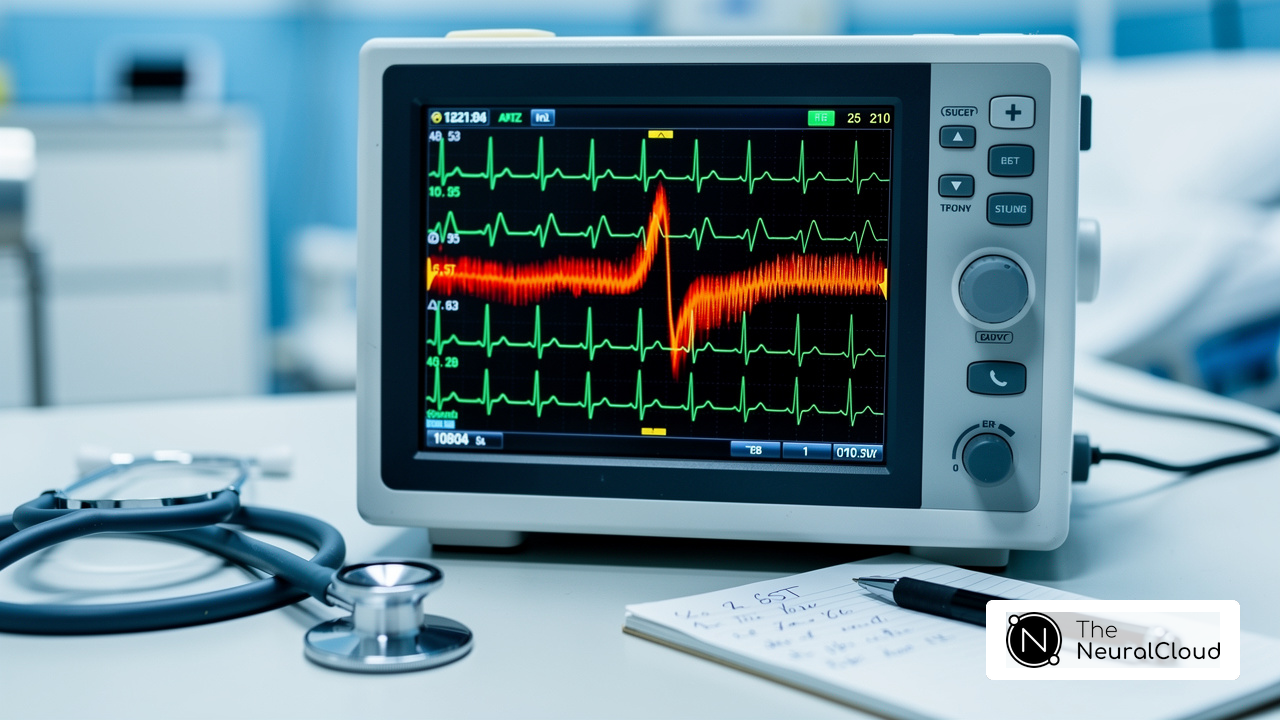
MaxYield™ effectively maps ECG signals by filtering out noise. It isolates and labels key features, including P-wave, QRS complex, and T-wave onsets and offsets. This allows for beat-by-beat evaluation and processes 200,000 heartbeats in under 5 minutes. By incorporating clinical knowledge into ECG evaluation products, developers can enhance diagnostic precision and patient results. This makes the comprehension of the ECG axis diagram not just a technical requirement but a crucial element of managing cardiac health. Additionally, MaxYield™ streamlines workflow efficiency by automating repetitive tasks and providing a clean, neuralized signal that enhances the overall ECG analysis process. Ultimately, mastering ECG orientation can significantly impact patient care and outcomes.

Explore Methods for ECG Axis Interpretation
Interpreting the ECG axis presents various challenges that can impact clinical decision-making. Several methods exist for interpreting the ECG axis, each offering unique advantages:
- The Quadrant Method: This straightforward approach examines leads I and aVF. If both leads are positive, the orientation is classified as normal. If lead I is negative and lead aVF is positive, it suggests left deviation (LAD). It's known for being both efficient and effective in real-world clinical settings.
- Hexaxial Reference System: This technique entails charting the QRS complex on a hexaxial diagram, enabling accurate orientation identification based on the angles of the limb leads. The ECG axis diagram provides a visual representation that aids in understanding the heart's electrical activity.
- The Isoelectric Lead Method: This method identifies the lead with the most balanced QRS complex, known as the isoelectric lead. The orientation is then established based on the lead that is perpendicular to this isoelectric lead, providing a dependable method of evaluation.
- Computerized Analysis: Advanced ECG machines employ algorithms to automatically compute the orientation, delivering quick and precise results. This method is particularly beneficial in high-volume clinical settings, where time efficiency is crucial.
Recent studies show that the Quadrant Method maintains high precision in interpretation. Optimal angles around 20° are particularly effective for identifying conditions like left ventricular systolic dysfunction (LVSD) and hypertrophic cardiomyopathy (HCM). The integration of AI in ECG analysis further enhances the diagnostic capabilities of these methods. This advancement not only streamlines the process but also enhances accuracy, leading to better patient care. Experts stress the need for collaboration among healthcare providers trained in ECG interpretation. This teamwork maximizes the effectiveness of these methods in clinical settings.

Analyze Common ECG Axis Deviations and Their Implications
Understanding the ECG axis diagram and its common deviations is vital for accurate diagnosis and effective patient management in clinical practice. Here are the key deviations:
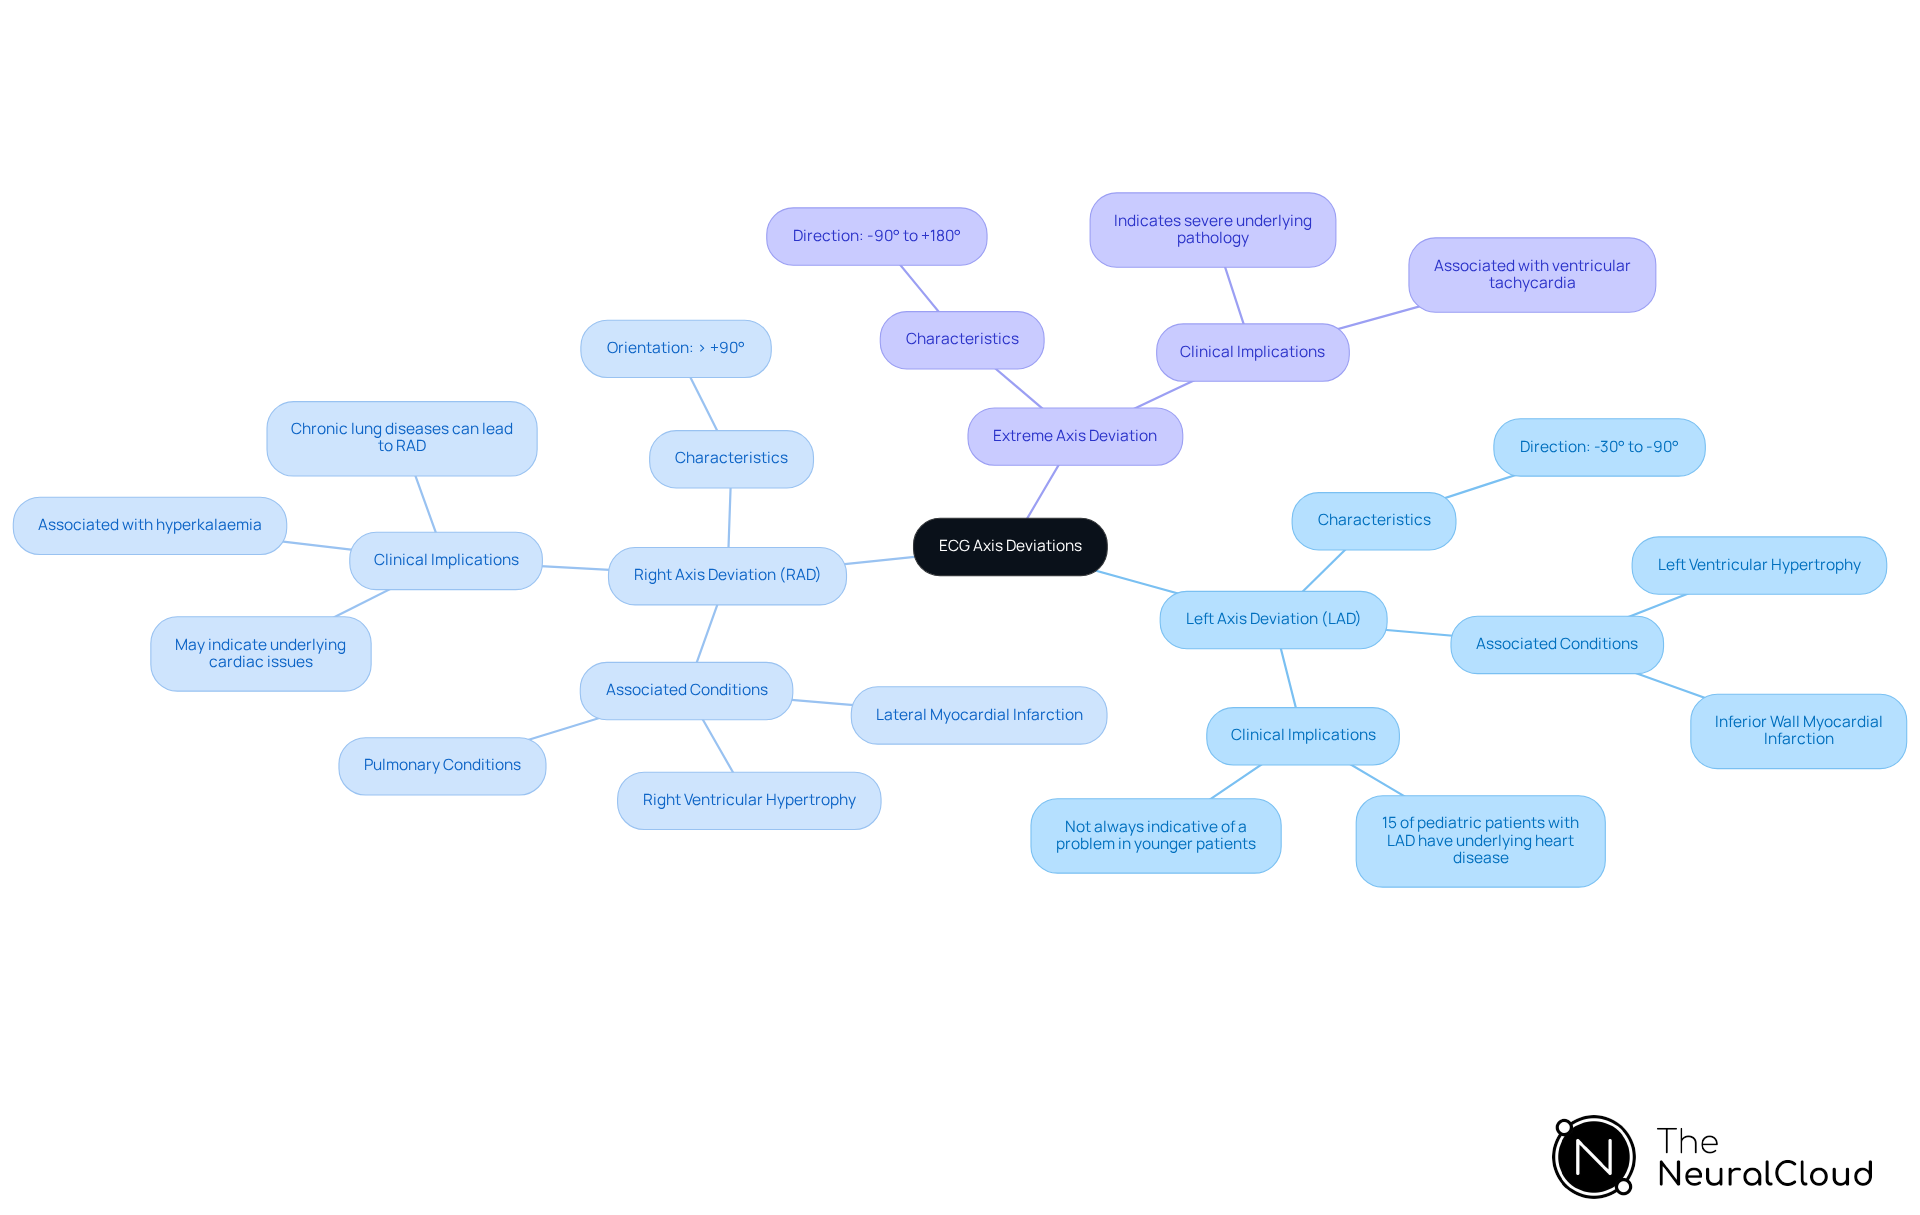
- Left Axis Deviation (LAD): This deviation is characterized by a direction between -30° and -90°. It can suggest conditions such as left ventricular hypertrophy or inferior wall myocardial infarction. Interestingly, in pediatric populations, only 15% of patients with incidentally discovered LAD had underlying heart disease upon further evaluation. It's important for clinicians to remember that in younger patients, LAD doesn't always mean there's a problem.
- Right Axis Deviation (RAD): An orientation greater than +90° indicates right ventricular hypertrophy or pulmonary conditions. RAD can also occur in cases of lateral myocardial infarction. This variation is significant as it may indicate underlying cardiac issues that require further investigation.
- Extreme Axis Deviation: This occurs when the axis is between -90° and +180°, often indicating severe underlying pathology. Clinicians must investigate further when this anomaly is observed, as it can be associated with critical conditions such as ventricular tachycardia.
Understanding these variations helps clinicians decide on necessary tests and treatment options, such as those illustrated in the ecg axis diagram. The implications of these deviations can vary significantly across different patient demographics, highlighting the need for tailored approaches in ECG interpretation. By mastering these deviations, healthcare professionals can enhance their diagnostic accuracy and tailor treatment strategies to individual patient needs.
Integrate Advanced Technologies for Enhanced ECG Analysis
The integration of advanced technologies into ECG evaluation presents both challenges and opportunities for cardiac diagnostics. Key advancements include:
- AI-Powered Interpretation: Machine learning algorithms can rapidly analyze ECG data, identifying patterns and anomalies that may elude human interpretation. This technology plays a crucial role in diagnosing conditions such as arrhythmias and ischemia, enhancing diagnostic accuracy. Recent studies have shown that AI-augmented ECG evaluation achieved a 99.1% negative predictive value for identifying left ventricular systolic dysfunction, showcasing its potential as a scalable screening tool in various healthcare environments.
- Real-Time Data Processing: Platforms like Neural Cloud Solutions' MaxYield can process ECG data in real-time, delivering immediate feedback to clinicians. In acute care settings, making timely decisions can really make a difference in patient outcomes. MaxYield's automated evaluation can produce insights from 200,000 heartbeats in under 5 minutes, streamlining workflows and improving clinical decision-making.
- Visualization Tools: Advanced visualization software, such as Insight360, empowers clinicians to create customizable dashboards and reports, improving the interpretability of ECG data. These tools facilitate the visualization of trends and enhance communication of findings among healthcare teams, transforming MaxYield’s clean ECG data into interactive, clinical-ready reports.
- Integration with Wearable Technology: The rise of wearable ECG monitors allows for continuous monitoring and early detection of cardiac events. By combining data from these devices with advanced evaluation platforms like MaxYield, healthcare providers can enhance patient outcomes through proactive management of cardiac health. For instance, a study demonstrated the effectiveness of AI-enabled ECG screening in identifying previously undiagnosed hypertrophic cardiomyopathy (HCM), leading to 11 new diagnoses.
As cardiac diagnostics evolve, adopting advanced technologies like MaxYield's automated noise reduction and adaptive algorithms is crucial. These innovations enhance the accuracy and efficiency of ECG analysis. Additionally, the noise filtering and P, QRS, and T wave highlighting features of MaxYield further streamline workflows and improve diagnostic precision. Embracing these innovations will not only refine diagnostic processes but also elevate the standard of cardiac care delivered to patients.

Conclusion
Clinicians face significant challenges in accurately interpreting ECG axis, which is crucial for effective patient care. By understanding the ECG axis and its clinical significance, healthcare professionals can better identify various cardiac conditions, leading to timely and effective interventions. Using advanced diagrams and technologies simplifies the interpretation process and empowers clinicians to make informed decisions based on precise data.
Throughout the article, key methods for interpreting the ECG axis were explored, including:
- The Quadrant Method
- Hexaxial Reference System
- Computerized analysis
Each method offers unique advantages that can be leveraged in clinical practice. Additionally, common deviations such as left and right axis deviations were discussed, highlighting their implications for patient management. AI and real-time data processing make these methods even more effective for clinicians, ensuring they are equipped with the tools necessary for accurate assessments.
As the landscape of cardiac diagnostics continues to evolve, embracing advanced technologies like MaxYield and Insight360 is crucial. These innovations not only streamline workflows but also elevate the standard of care provided to patients. By prioritizing the mastery of ECG axis interpretation and leveraging cutting-edge tools, healthcare professionals can significantly impact patient health outcomes and contribute to the advancement of cardiac care in Canada.
Frequently Asked Questions
What is the ECG axis and why is it clinically important?
The ECG axis indicates the overall direction of electrical activity during heart depolarization, measured in degrees on a hexaxial reference system. Understanding the ECG axis is crucial for identifying various cardiac conditions, as deviations can signal underlying issues such as hypertrophy or conduction blocks.
What is the normal range for QRS orientation in the ECG axis?
The normal QRS orientation typically ranges from -30° to +90°.
What does a left orientation shift (LAD) indicate?
A left orientation shift (LAD), which occurs between -30° and -90°, is often associated with left ventricular hypertrophy and inferior myocardial infarction.
What does a right orientation shift (RAD) suggest?
A right orientation shift (RAD), spanning from +90° to +180°, may indicate right ventricular hypertrophy or pulmonary issues.
How do variations in cardiac orientation affect clinical outcomes?
Studies have shown that variations in cardiac orientation can significantly influence clinical outcomes, with patients exhibiting LAD facing a higher risk of all-cause mortality compared to those with a normal orientation.
How does MaxYield™ enhance ECG analysis?
MaxYield™ effectively maps ECG signals by filtering out noise and isolating key features such as P-wave, QRS complex, and T-wave onsets and offsets. It allows for beat-by-beat evaluation and processes 200,000 heartbeats in under 5 minutes, improving diagnostic precision and patient results.
What role does the ECG axis diagram play in managing cardiac health?
Mastering the ECG axis diagram is essential for managing cardiac health, as it aids in the accurate assessment of heart conditions and can significantly impact patient care and outcomes.
List of Sources
- Define ECG Axis and Its Clinical Importance
- theneuralcloud.com (https://theneuralcloud.com/post/master-ecg-axis-deviation-key-insights-for-health-tech-developers)
- Researchers unlock hidden geometry of the heart to revolutionise ECG interpretation | King's College London (https://kcl.ac.uk/news/researchers-unlock-hidden-geometry-of-the-heart-to-revolutionise-ecg-interpretation)
- ECG Axis Interpretation (https://litfl.com/ecg-axis-interpretation)
- What is Cardiac Axis? | ECG Interpretation | Geeky Medics (https://geekymedics.com/what-is-cardiac-axis)
- Clinical impact of left and right axis deviations with narrow QRS complex on 3-year outcomes in a hospital-based population in Japan - Scientific Reports (https://nature.com/articles/s41598-021-88259-8)
- Explore Methods for ECG Axis Interpretation
- Breakthrough in heart health: A new approach to interpreting ECG data using large language models (https://eurekalert.org/news-releases/1073406)
- Optimizing single-lead ECG axis for AI-based detection of myocardial diseases - npj Cardiovascular Health (https://nature.com/articles/s44325-026-00134-5)
- Skills Laboratory: How to determine and interpret the mean electrical axis | dvm360 (https://dvm360.com/view/skills-laboratory-how-determine-and-interpret-mean-electrical-axis)
- Electrical Right and Left Axis Deviation - StatPearls - NCBI Bookshelf (https://ncbi.nlm.nih.gov/books/NBK470532)
- ECG Axis Interpretation (https://litfl.com/ecg-axis-interpretation)
- Analyze Common ECG Axis Deviations and Their Implications
- ECG Axis Interpretation (https://litfl.com/ecg-axis-interpretation)
- Cardiac Axis Deviation in Systemic Sclerosis-Related Pulmonary Hypertension (https://thecardiologyadvisor.com/news/cardiac-axis-deviation-in-systemic-sclerosis-related-pulmonary-hypertension)
- Isolated left axis deviation may not necessitate further work up | 2 Minute Medicine (https://2minutemedicine.com/isolated-left-axis-deviation-may-not-necessitate-further-work-up)
- Right Axis Deviation (RAD) (https://litfl.com/right-axis-deviation-rad-ecg-library)
- Clinical impact of left and right axis deviations with narrow QRS complex on 3-year outcomes in a hospital-based population in Japan - Scientific Reports (https://nature.com/articles/s41598-021-88259-8)
- Integrate Advanced Technologies for Enhanced ECG Analysis
- AccurKardia (https://accurkardia.com/news)
- ECG market keeps evolving thanks to AI, home monitoring and Epic integration (https://cardiovascularbusiness.com/topics/cardiac-imaging/electrocardiography-ecg/ecg-market-keeps-evolving-thanks-ai-home-monitoring-and-epic-integration)
- AI-powered electrocardiogram detects early signs of heart failure (https://utsouthwestern.edu/newsroom/articles/year-2026/may-ai-powered-electrocardiogram.html)
- Three New Studies Show Viz.ai’s Cardio Suite Speeds Detection of Cardiac Disease and Improves Patient Follow-Up (https://viz.ai/news/three-new-studies-show-viz-ais-cardio-suite-speeds-detection-of-cardiac-disease-and-improves-patient-follow-up)
- AI-ECG Momentum and Rising Competition Reshape Diagnostic Cardiology in 2026 (https://signifyresearch.net/insights/diagnostic-cardiology-market-bouncing-into-2026)