Introduction
Accurate cardiac assessments hinge on understanding T wave morphology in ECG readings, as these subtle signals can indicate serious health issues. This article delves into the causes, clinical implications, and interpretation techniques of elevated T waves, offering healthcare professionals essential insights to enhance their diagnostic capabilities.
Clinicians often face challenges in distinguishing true T wave abnormalities from similar conditions. This accuracy can significantly impact patient outcomes.
Clarify Normal T Wave Characteristics
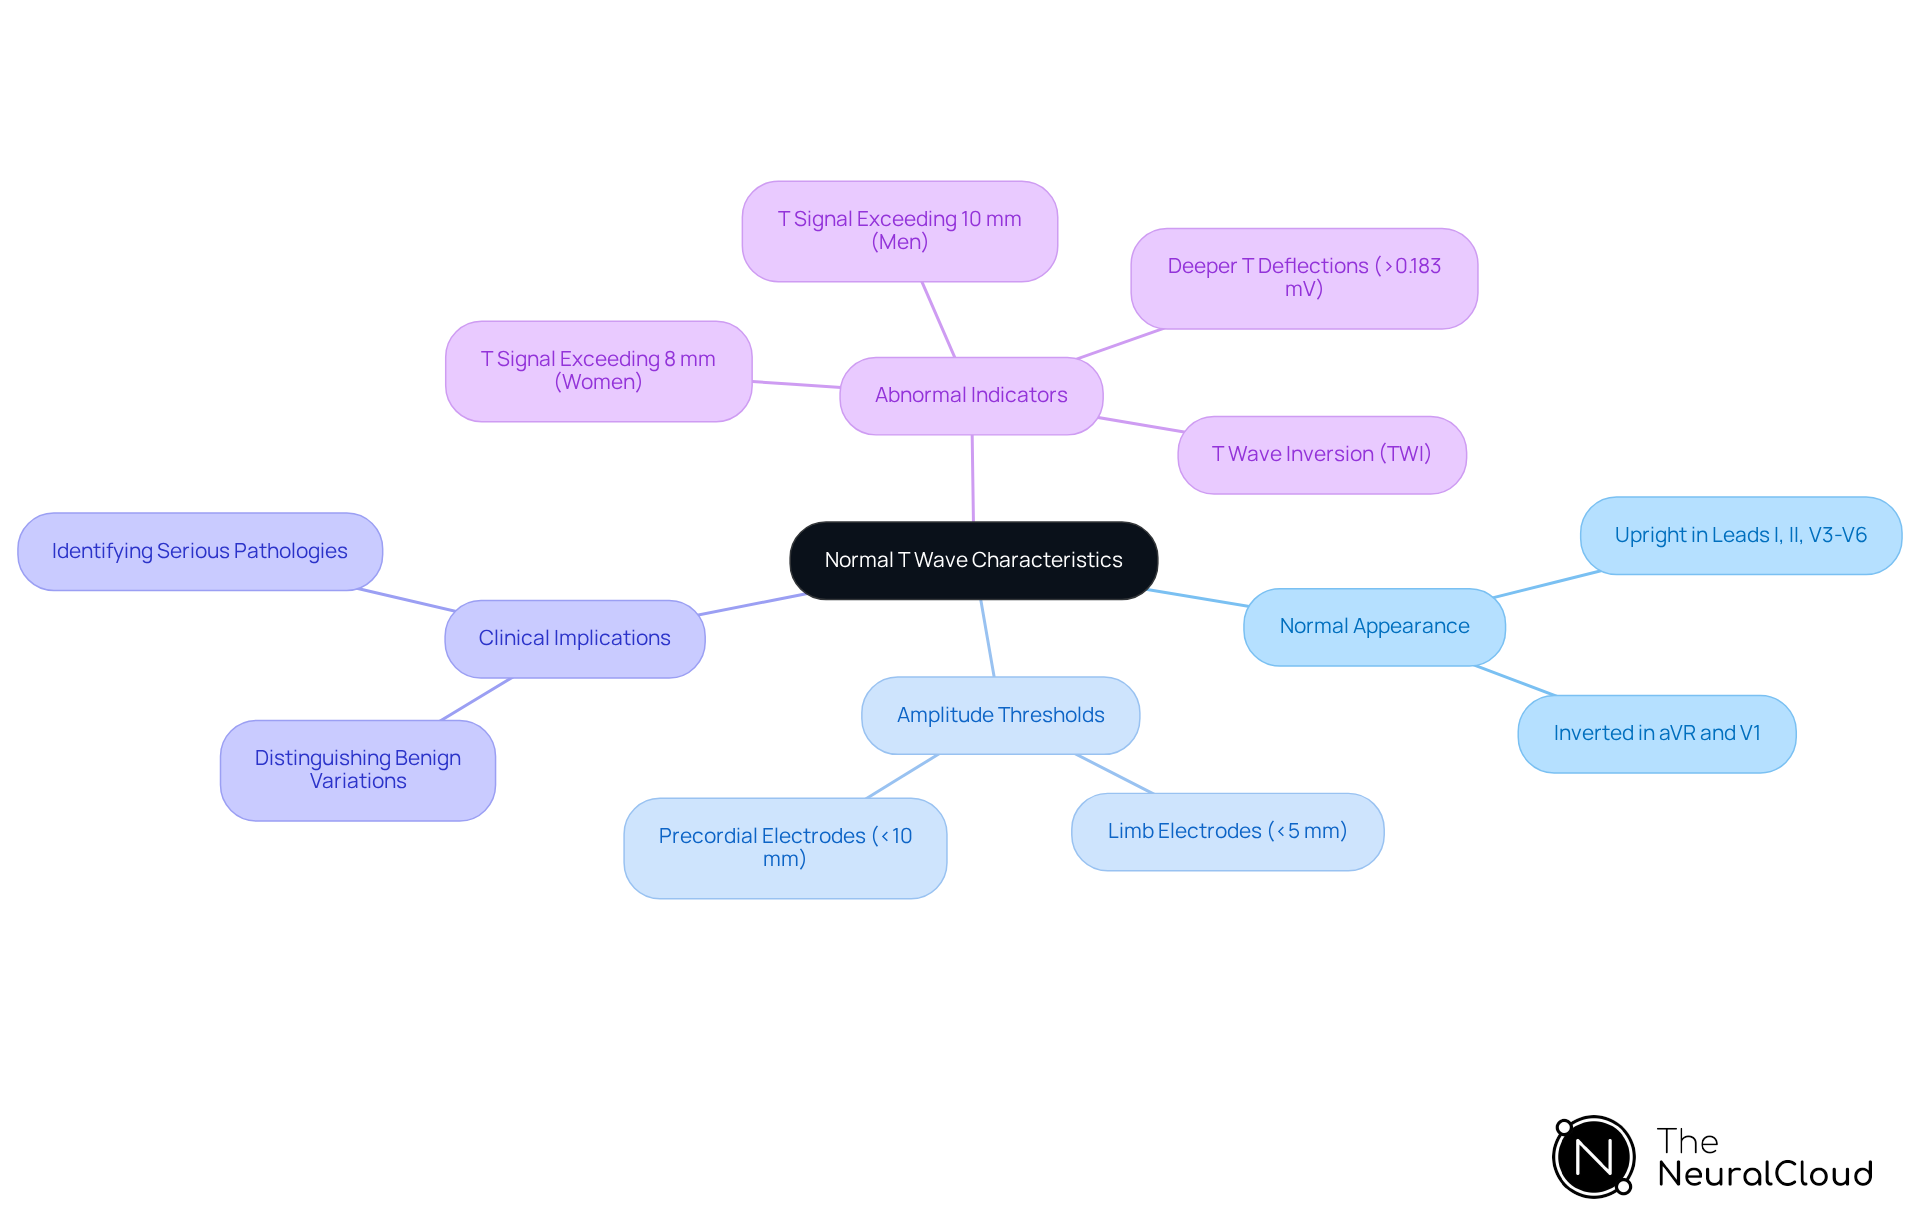
Understanding the nuances of T deflections in ECG analysis is essential for accurate cardiac assessments. Normal T deflections are primarily upright in most configurations, with exceptions in aVR and V1 where they may appear inverted. Typically, the amplitude of T signals should be below 5 mm in limb electrodes and under 10 mm in precordial electrodes. In adults, T deflections are generally positive in leads I, II, and V3-V6, with the greatest amplitudes observed in V2 and V3. The T signal usually has an asymmetric form, characterized by a gradual rise followed by a sharper drop. Being aware of these normal parameters helps clinicians spot abnormalities in T shape morphology more effectively, which can signal various cardiac conditions.
For example, if a T signal exceeds 10 mm in men or 8 mm in women, it is considered abnormal and often warrants further investigation. Research indicates that T abnormalities affecting different regions of the heart are seven times more likely to indicate underlying disease. Additionally, deeper T deflections (greater than 0.183 mV) significantly increase the likelihood of a cardiomyopathy diagnosis, with an 18 times greater risk noted in affected patients. Comprehending these normal T characteristics allows clinicians to distinguish between benign variations and serious pathologies like hyperkalemia or myocardial ischemia, ultimately improving diagnostic accuracy and patient outcomes. By mastering these T characteristics, healthcare professionals can significantly enhance their diagnostic capabilities and improve patient outcomes.
Explore Causes of Elevated T Waves
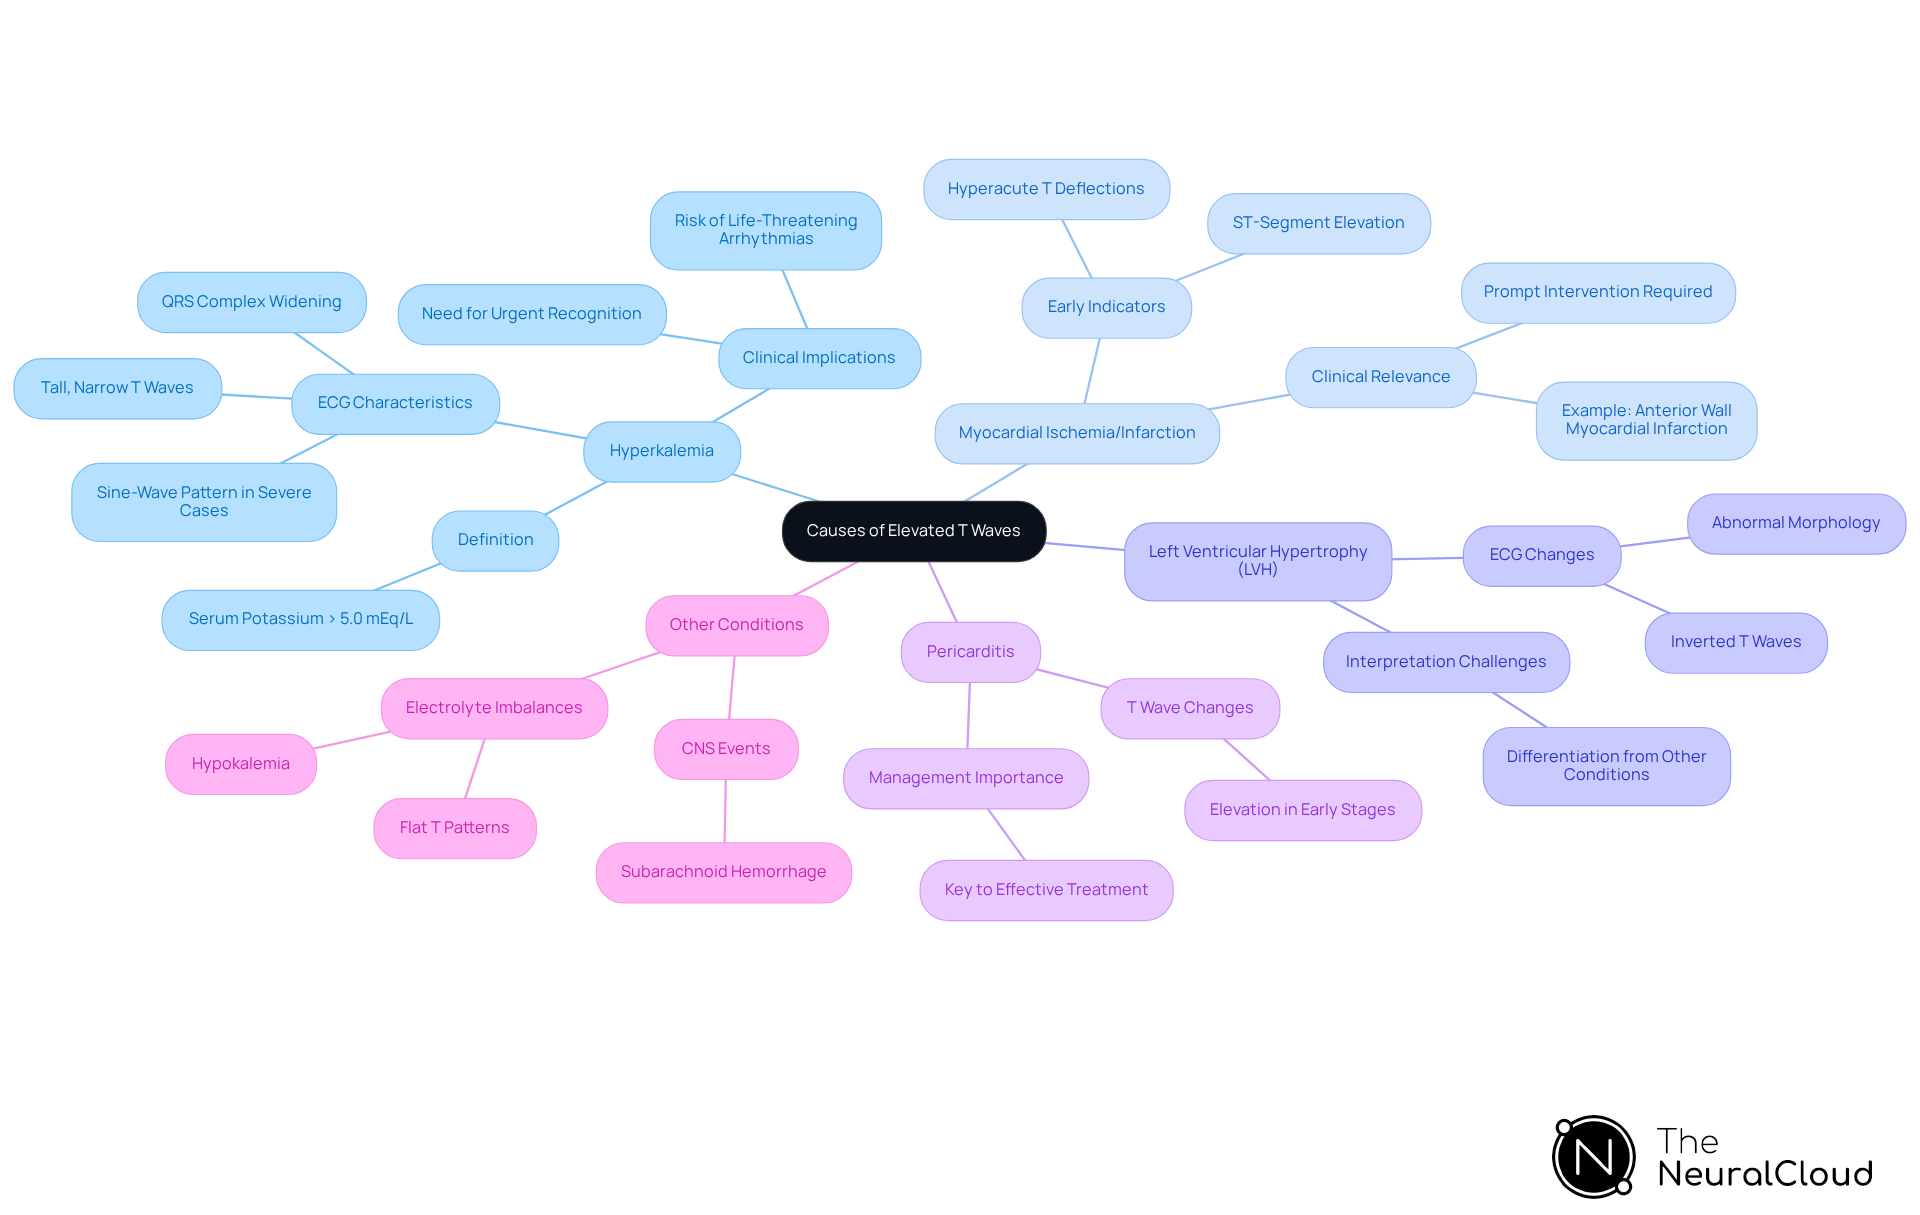
Understanding the causes of elevated T wave ECG is crucial for effective analysis and patient care. Elevated T waves can arise from several conditions, including:
- Hyperkalemia: Elevated potassium levels, defined as surpassing 5.0 mEq/L, can result in peaked T shapes that are frequently tall and narrow. This condition is critical to recognize, as failure to do so can lead to severe cardiac events. In severe instances, the QRS complex may broaden, and T waves can blend with the QRS complexes, forming a sine-pattern, which is a medical emergency.
- Elevated T wave ECG peaks may suggest early indications of myocardial ischemia or infarction, especially in the context of acute coronary syndromes. Hyperacute T deflections are often among the initial ECG alterations noted in these situations, acting as an essential indicator for prompt intervention. For example, a 12-lead ECG from a patient with an acute anterior wall myocardial infarction displayed significant ST-segment elevation alongside hyperacute T deflections, highlighting the necessity for swift diagnosis and treatment.
- Left Ventricular Hypertrophy (LVH): In individuals with LVH, T deflections may become inverted or display abnormal morphology due to increased myocardial mass and altered repolarization. This change can make it trickier to interpret ECG results, necessitating careful analysis to differentiate between LVH and other conditions.
- Pericarditis: Inflammation of the pericardium can result in T changes, including elevation, especially in the initial stages of the condition. Spotting these changes is key to managing and treating the condition effectively.
- Other Conditions: Additional causes include central nervous system events, such as subarachnoid hemorrhage, and various electrolyte imbalances. For instance, flat T patterns may suggest ischemia or electrolyte imbalances such as hypokalemia, leading to further investigation into possible underlying conditions.
Comprehending these causes is essential for prompt diagnosis and intervention, as elevated T wave ECG patterns can indicate serious underlying health concerns. The integration of advanced ECG analysis technologies, such as those offered by Neural Cloud Solutions' MaxYield system, enhances the ability to automate waveform labeling and improve diagnostic precision. MaxYield's advanced noise filtering and automated signal processing streamline workflow efficiency, allowing for a clearer interpretation of ECG data. Additionally, Insight360 serves as a customizable visualization tool that transforms MaxYield’s clean ECG data into interactive dashboards and clinical-ready reports, further enhancing the capabilities for health tech developers aiming to improve ECG analysis accuracy and efficiency through AI-driven automation. By leveraging advanced technologies like MaxYield, healthcare professionals can enhance their diagnostic capabilities and improve patient outcomes.
Analyze Clinical Significance of Elevated T Waves
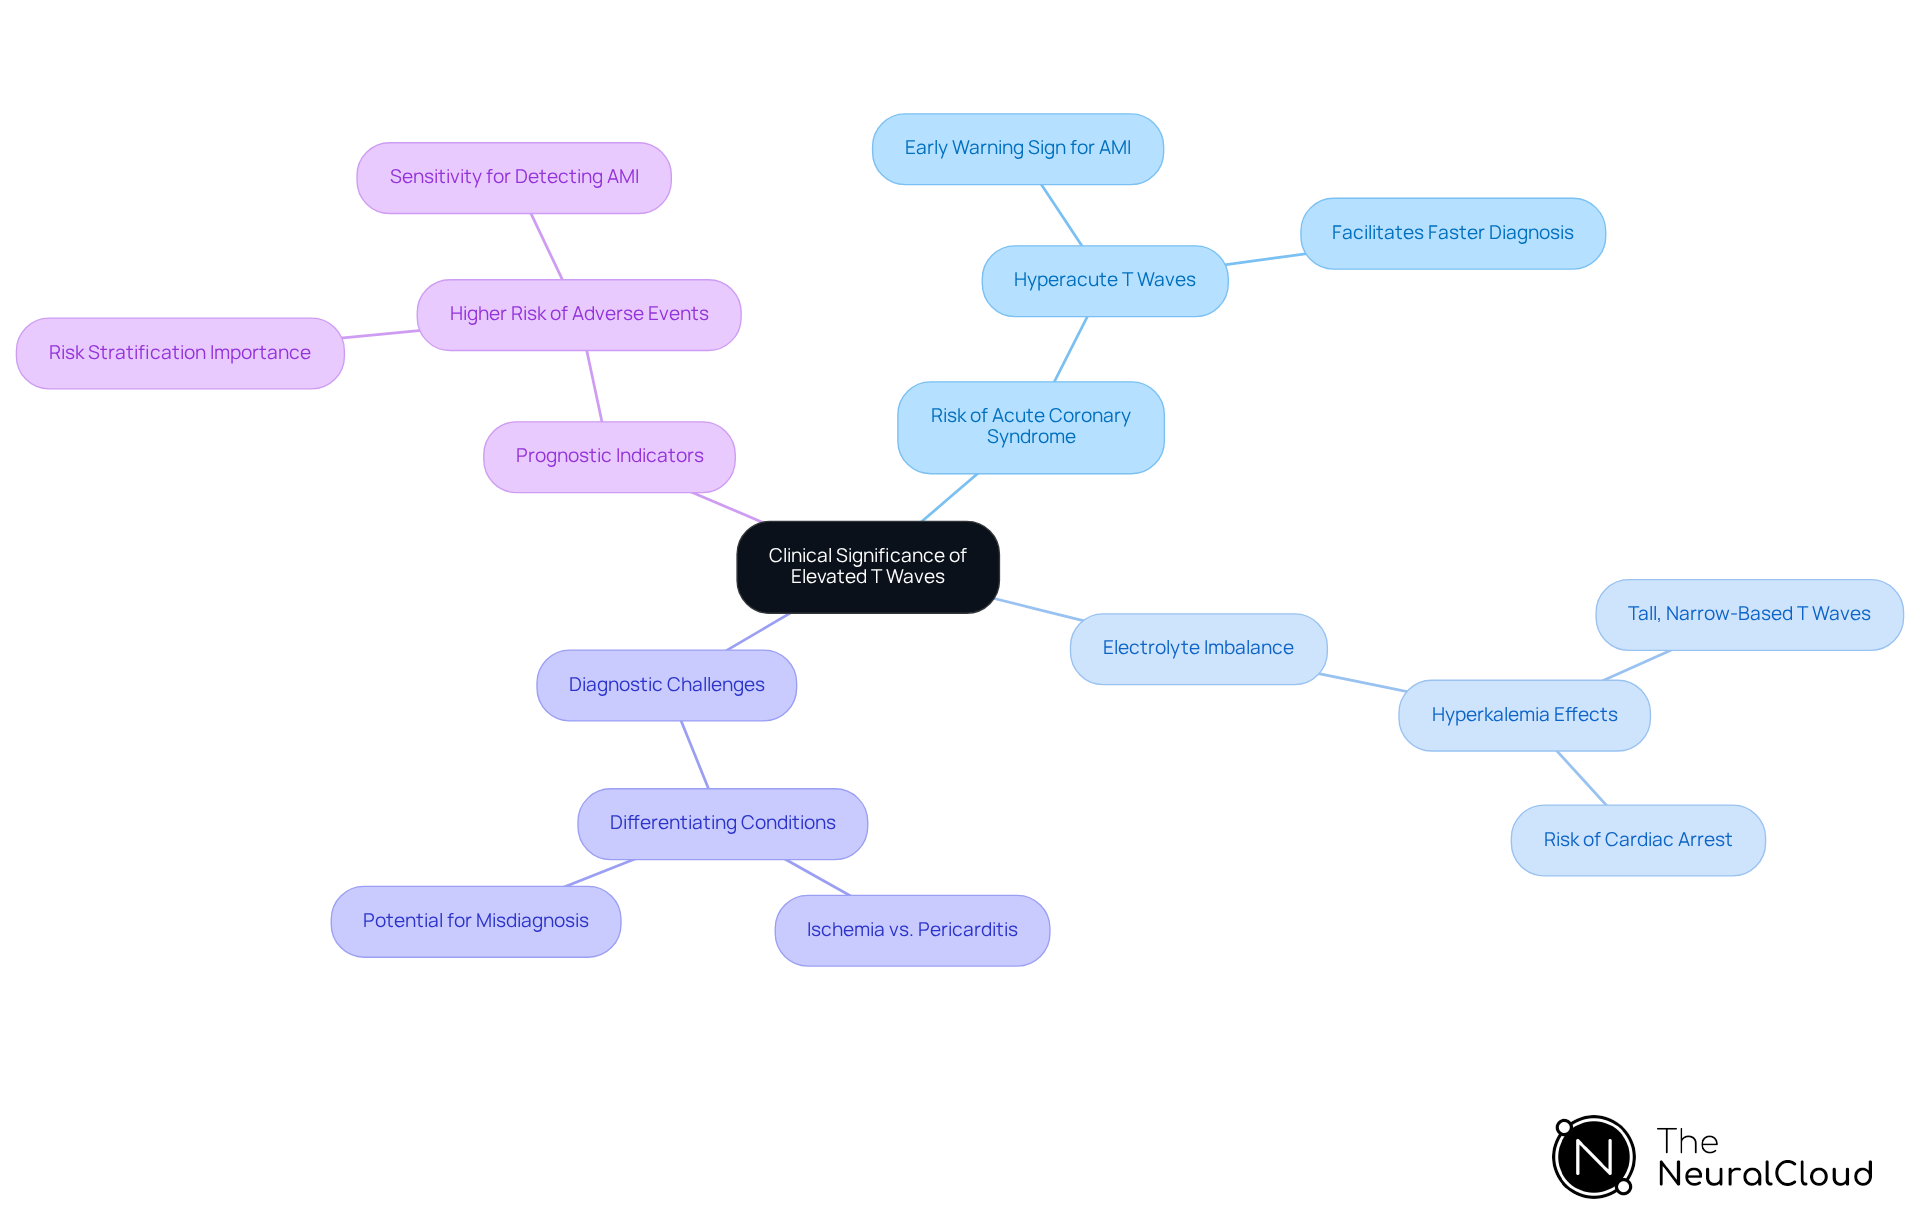
Elevated T wave ECG presents significant clinical challenges that can impact patient outcomes. These challenges include:
- Risk of Acute Coronary Syndrome: Hyperacute T deflections are often linked with acute myocardial infarction (AMI) and can act as an early warning sign for clinicians. Recognizing these changes can lead to prompt intervention, potentially facilitating a diagnosis of AMI up to three hours faster. Research indicates that tall, peaked T forms may signify hyperacute T waves, which are reflected in an elevated T wave ECG associated with early ST elevation myocardial infarction. This is particularly true if ischemic symptoms begin within 30 minutes.
- Electrolyte Imbalance: Elevated T wave ECG peaks due to hyperkalemia can indicate severe electrolyte disturbances that require prompt treatment to prevent cardiac arrest. In instances of hyperkalemia, T peaks may appear tall and narrow-based. Related ECG findings can include decreased P peak amplitude and widened QRS duration, which are essential for diagnosing this condition.
- Diagnostic challenges arise as elevated T wave ECG can sometimes resemble other conditions, leading to potential misdiagnosis. For example, differentiating between T changes resulting from ischemia and those induced by pericarditis necessitates thorough clinical correlation and further testing. Misdiagnosis can lead to inappropriate management strategies, complicating patient care.
- Prognostic Indicators: The presence of elevated T wave ECG signals can serve as a prognostic marker for various cardiac conditions, indicating a higher risk of adverse events in patients with underlying heart disease. Clinical studies have demonstrated that T changes in acute myocardial infarction can double the sensitivity for detecting occlusive myocardial infarction, highlighting their significance in risk stratification.
It's crucial to grasp the clinical significance of these findings for effective patient management. The integration of advanced technologies like MaxYield™ from Neural Cloud Solutions boosts ECG analysis accuracy. It transforms lengthy, noisy recordings into clean signals, helping healthcare professionals recognize T abnormalities more effectively. Testimonials from experts highlight MaxYield™'s precision and noise reduction capabilities, reinforcing its value in clinical settings. Additionally, Neural Cloud Solutions is currently pursuing FDA Class II SaMD clearance, ensuring compliance and reliability in ECG analysis.
Implement Techniques for T Wave Interpretation
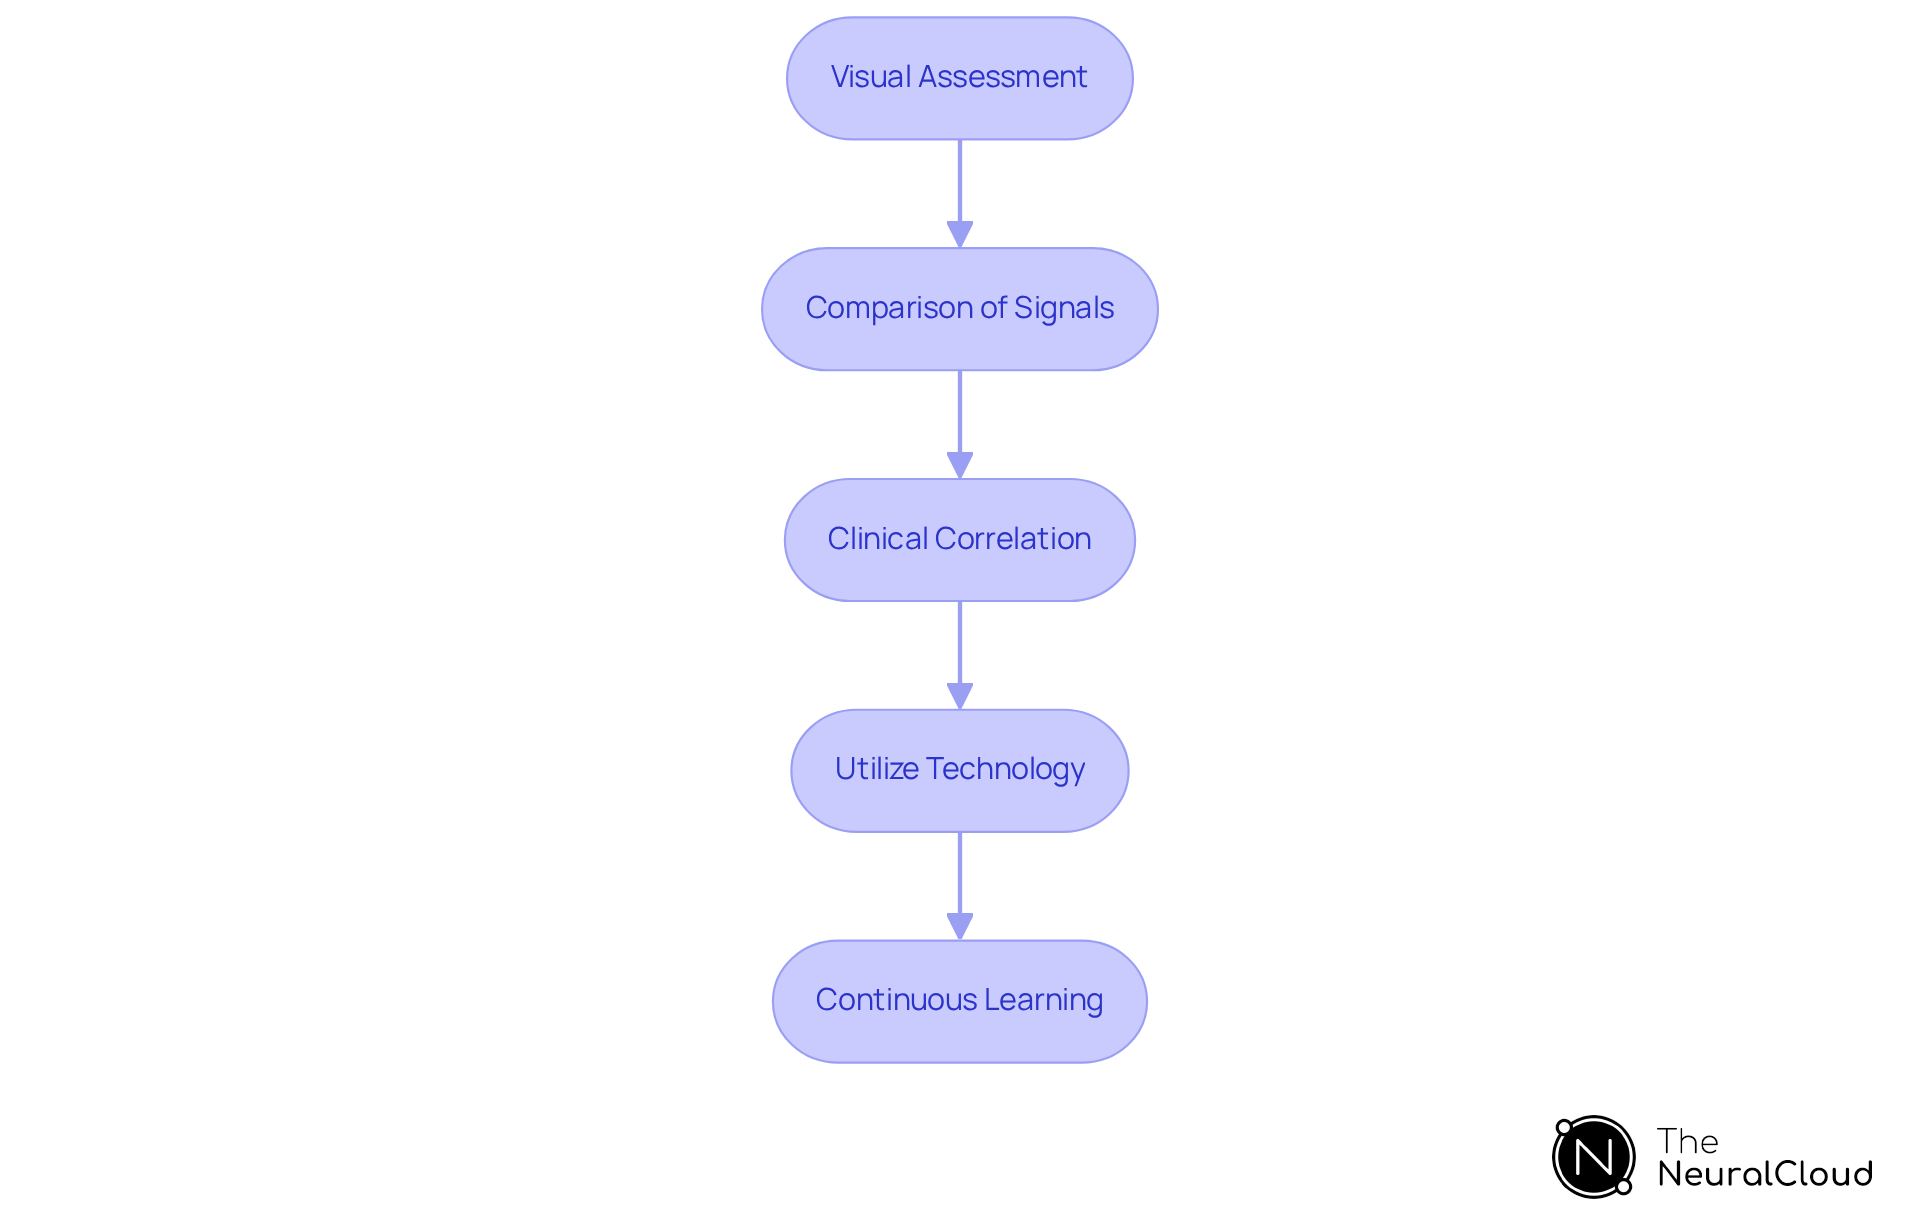
Interpreting T waves can be challenging for clinicians, but employing specific techniques can enhance accuracy and patient care. To effectively interpret T waves, clinicians should consider the following techniques:
- Visual Assessment: Begin by visually inspecting the T shape morphology in relation to the preceding QRS complex. Look for symmetry, amplitude, and duration. Normal T shapes should be smooth and rounded, while abnormal T forms may appear peaked, flat, or inverted. Peaked T deflections, often surpassing 5 mm in limb electrodes and 10 mm in precordial electrodes, can signify serious conditions such as hyperkalemia, which is associated with elevated T wave ECG and elevated serum potassium levels.
- Comparison of Signals: Examine T patterns across various electrodes to recognize consistent trends. For instance, T segment inversions in several channels may imply ischemia, while isolated alterations may signify localized problems. Understanding T morphology variations across leads is crucial for accurate diagnosis.
- Clinical Correlation: Always relate T findings with the patient's clinical history and symptoms. For example, a patient showing chest pain and increased T patterns should be assessed for possible myocardial ischemia. T-wave characteristics can independently predict major adverse cardiovascular occurrences (MACE), making clinical context essential.
- Utilize Technology: Leverage advanced ECG analysis tools, such as those provided by Neural Cloud Solutions' MaxYield, to enhance signal clarity and isolate T abnormalities. This device-agnostic ECG intelligence layer integrates seamlessly via API, SDK, or CDK without requiring hardware changes. MaxYield automates labeling and enhances signal processing, helping identify subtle changes often missed in standard readings. Additionally, the Insight360 tool transforms MaxYield’s clean ECG data into interactive dashboards and clinical-ready reports, enhancing the overall diagnostic process. AI integration has shown detection accuracy rates of 96-97% in identifying irregular heart rhythms, underscoring the value of advanced tools in clinical practice. Currently, MaxYield is pending FDA Class II SaMD clearance, which ensures it meets regulatory standards.
- Continuous Learning: Stay updated on the latest research and guidelines regarding T signal interpretation. Engaging in continuous education and training can enhance diagnostic skills and improve patient outcomes. Recent studies have emphasized the significance of understanding T shape morphology in relation to blood glucose levels, indicating a need for ongoing education in this evolving field.
By implementing these techniques, healthcare professionals can enhance their ability to interpret T waves accurately, leading to better patient management and care. Exploring the capabilities of MaxYield and Insight360 could transform your approach to ECG analysis and patient management.
Conclusion
Accurate interpretation of elevated T waves is essential for effective cardiac assessments and patient management. By mastering the characteristics of normal T waves and recognizing the implications of their elevation, healthcare professionals can significantly enhance their diagnostic capabilities. Elevated T waves can indicate serious conditions such as hyperkalemia, myocardial ischemia, and other cardiac pathologies, making it essential for clinicians to be well-versed in their interpretation.
Let’s explore the causes of elevated T waves, highlighting conditions like:
- Hyperkalemia
- Left ventricular hypertrophy
- Pericarditis
These conditions can complicate diagnosis and treatment. Recognizing these changes early is crucial, as they can serve as critical indicators for acute coronary syndromes and other serious health issues. Furthermore, the integration of advanced technologies, such as Neural Cloud Solutions' MaxYield and Insight360, enhances the accuracy of ECG analysis, allowing for clearer interpretations and improved patient outcomes.
In conclusion, embracing continuous education and advanced technologies will empower clinicians to enhance cardiac care and improve patient outcomes. By employing effective techniques and leveraging advanced ECG analysis tools, healthcare professionals can not only improve their diagnostic accuracy but also ensure timely interventions for their patients.
Frequently Asked Questions
What are the normal characteristics of T wave deflections in ECG analysis?
Normal T wave deflections are primarily upright in most configurations, except in leads aVR and V1 where they may appear inverted. The amplitude of T signals should typically be below 5 mm in limb electrodes and under 10 mm in precordial electrodes.
In which leads are T deflections generally positive in adults?
In adults, T deflections are generally positive in leads I, II, and V3-V6, with the greatest amplitudes observed in leads V2 and V3.
How is the shape of the T signal characterized?
The T signal usually has an asymmetric form, characterized by a gradual rise followed by a sharper drop.
What indicates an abnormal T signal?
A T signal exceeding 10 mm in men or 8 mm in women is considered abnormal and often warrants further investigation.
What is the significance of T abnormalities in different regions of the heart?
T abnormalities affecting different regions of the heart are seven times more likely to indicate underlying disease.
How does the depth of T deflections relate to cardiomyopathy diagnosis?
Deeper T deflections (greater than 0.183 mV) significantly increase the likelihood of a cardiomyopathy diagnosis, with an 18 times greater risk noted in affected patients.
Why is understanding normal T wave characteristics important for clinicians?
Comprehending normal T wave characteristics allows clinicians to distinguish between benign variations and serious pathologies, ultimately improving diagnostic accuracy and patient outcomes.
List of Sources
- Clarify Normal T Wave Characteristics
- ECG T Wave Inversion Features Predict Cardiomyopathy | www.PhysiciansWeekly.com (https://physiciansweekly.com/post/ecg-t-wave-inversion-features-predict-cardiomyopathy)
- T-Wave Morphology Opens New Door to Cardiovascular Mortality Prognosis (https://dicardiology.com/content/t-wave-morphology-opens-new-door-cardiovascular-mortality-prognosis)
- Home - Rheumatology Advisor (https://rheumatologyadvisor.com/news/st-t-t-wave-changes-most-common-ecg-abnormalities-sle-lupus)
- Explore Causes of Elevated T Waves
- ECG Diagnosis: Hyperacute T Waves - PMC (https://pmc.ncbi.nlm.nih.gov/articles/PMC4500486)
- Hyperkalemia ECG Changes: Peaked T Waves (https://powerfulmedical.com/blog/hyperkalemia-ecg-critical-changes)
- theneuralcloud.com (https://theneuralcloud.com/post/understanding-elevated-t-wave-meaning-for-enhanced-ecg-analysis)
- 68 causes of T wave, ST segment abnormalities (https://healio.com/cardiology/learn-the-heart/ecg-review/ecg-interpretation-tutorial/68-causes-of-t-wave-st-segment-abnormalities)
- Analyze Clinical Significance of Elevated T Waves
- EKG- Disorders of T Waves (https://cancertherapyadvisor.com/home/decision-support-in-medicine/hospital-medicine/ekg-disorders-of-t-waves)
- Hyperacute T-Waves: ECG Signs of Early MI (https://powerfulmedical.com/blog/hyperacute-t-waves)
- theneuralcloud.com (https://theneuralcloud.com/post/understanding-elevated-t-wave-meaning-for-enhanced-ecg-analysis)
- Acute Coronary Syndrome - StatPearls - NCBI Bookshelf (https://ncbi.nlm.nih.gov/books/NBK459157)
- Implement Techniques for T Wave Interpretation
- Statistical and spectral analysis of ECG signal towards achieving non-invasive blood glucose monitoring - PMC (https://pmc.ncbi.nlm.nih.gov/articles/PMC6921435)
- theneuralcloud.com (https://theneuralcloud.com/post/master-peaked-t-waves-essential-ecg-analysis-techniques)
- Study Shows Promising Results for ECG Technology (https://dicardiology.com/content/study-shows-promising-results-ecg-technology)