Introduction
Despite its critical role in cardiac care, accurate ECG interpretation remains a significant challenge for many healthcare professionals. Let’s explore best practices for analyzing heart ECG waves and discover advanced techniques and tools that can boost diagnostic accuracy and improve patient outcomes. This misinterpretation not only jeopardizes patient care but also hinders the effective integration of new technologies into clinical practice. Clinicians must navigate these challenges to fully harness the potential of ECG analysis for improved patient outcomes.
Understand ECG Waveform Components and Their Significance
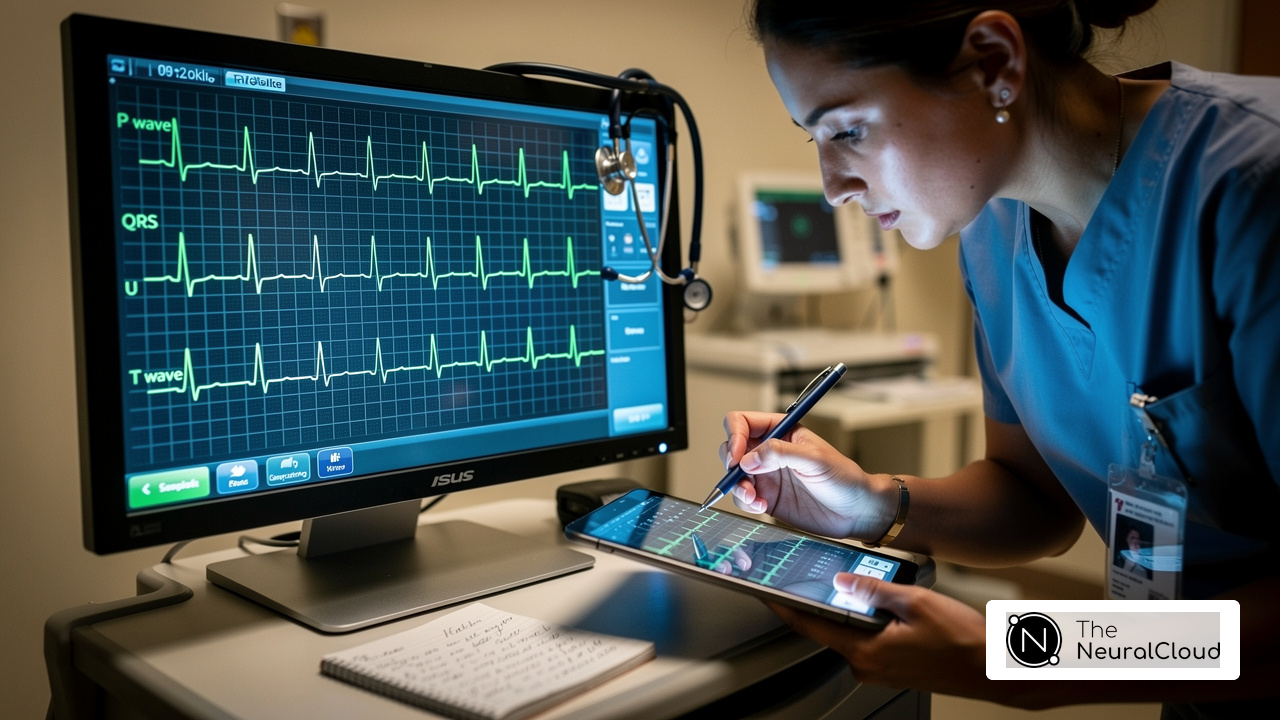
Accurate interpretation of heart ECG waves is essential, yet it often presents significant challenges for healthcare professionals. Heart ECG waves consist of several key components, including the P wave, QRS complex, T wave, and occasionally the U wave, each representing distinct phases of the heart's electrical cycle.
- P Wave: This small upward deflection indicates atrial depolarization, the electrical activation of the atria before contraction. Examining the morphology of the P wave is crucial for recognizing atrial enlargement or rhythm disturbances, which can greatly affect outcomes for individuals. As noted by Thomas Cascino MD, "The P wave represents atrial depolarization. It is normally upright in most leads except aVR."
- QRS Complex: The most prominent feature of the ECG, the QRS complex represents ventricular depolarization and typically lasts between 0.06 to 0.10 seconds. Variations in QRS duration and morphology can indicate conditions such as bundle branch blocks or ventricular hypertrophy, guiding further diagnostic evaluation and treatment decisions. Kyle Hastings emphasizes that "the QRS complex represents ventricular depolarization."
- T Wave: Following the QRS complex, the T wave reflects ventricular repolarization. Abnormalities in the T wave, such as inversion or flattening, can signal ischemia or electrolyte imbalances, which are critical for timely intervention in cardiac care. Hastings states, "The T wave represents this recovery phase, ventricular repolarization."
- U Wave: Although not always visible, the U wave can indicate delayed ventricular repolarization and is often associated with conditions such as hypokalemia or bradycardia. Its presence can provide additional insights into an individual's cardiac health.
Grasping these components is key to accurately interpreting heart ECG waves, which can really influence clinical decisions. A structured approach to analyzing heart ECG waves enhances diagnostic confidence and supports improved patient outcomes in Canadian healthcare settings.
Neural Cloud Solutions Inc.'s MaxYield™ platform transforms the evaluation of heart ECG waves by employing advanced noise filtering and distinct wave recognition capabilities. This cutting-edge technology helps healthcare professionals quickly separate heart ECG waves from recordings that may be muddled by noise or movement, ensuring that critical data is not lost. As Dr. Alan Rabinowitz notes, "MaxYield's precision rivals human interpretation, making it an invaluable tool for clinicians."
For example, a recent study emphasized the significance of precise interpretation of heart ECG waves in forecasting the risk of sudden cardiac death, illustrating the practical consequences of these evaluations in clinical environments. With MaxYield™, healthcare providers can enhance their efficiency in evaluating heart ECG waves, ultimately leading to better results for individuals. Furthermore, it is important to note that MaxYield™ is currently pending FDA Class II SaMD clearance, ensuring compliance with regulatory standards. This positions the platform as a reliable choice for clinicians in Canada, particularly in cities like Toronto and Calgary, where advanced cardiac care is essential. With MaxYield™, clinicians can navigate these complexities more effectively, ultimately enhancing patient care and safety by analyzing heart ECG waves.

Implement Advanced Signal Processing Techniques for Accurate ECG Analysis
Noise interference poses a significant challenge in achieving high-fidelity evaluation of heart ECG waves, making advanced signal processing techniques essential. Here are some best practices:
- Adaptive Filtering: This technique dynamically adjusts filter parameters in real-time to minimize noise from muscle artifacts and electrical interference, making it particularly effective in environments where patient movement can compromise signal quality. Recent advancements in adaptive filtering have shown significant improvements in QRS interval accuracy, reducing differences to as low as 4.28 ms. MaxYield™ stands out by using an adaptive algorithm that learns and improves with every use, boosting diagnostic accuracy over time. Furthermore, it is important to note that MaxYield™ is currently pending FDA Class II SaMD clearance, ensuring compliance with regulatory standards.
- Wavelet Transform: Utilizing wavelet transforms allows for multi-resolution examination of ECG signals, enabling the detection of transient features that may be overlooked by traditional Fourier methods. This method is especially beneficial for identifying arrhythmias, as it captures subtle changes in heart ECG waves that indicate potential cardiac issues.
- Machine Learning Algorithms: The integration of machine learning enhances the classification of ECG patterns. By training algorithms on extensive datasets, healthcare providers can improve the recognition of normal and abnormal heart ECG waves, thereby increasing diagnostic accuracy. This approach is becoming a hallmark of modern ECG analysis, facilitating early detection of cardiac abnormalities. Expert endorsements from Dr. Alan Rabinowitz, Dr. Brett Heilbron, and Dr. Marc W. Deyell emphasize that MaxYield™'s precision rivals human interpretation, particularly in noise reduction benefits.
- Real-Time Processing: Implementing systems that process ECG information in real-time provides immediate feedback to clinicians, enabling quicker decision-making in critical situations. This feature is crucial for keeping an eye on patients recovering from heart procedures, helping catch any complications early on. Additionally, a sampling rate of 500 Hz has been found to deliver the most reliable noise detection and classification performance, further enhancing the effectiveness of real-time processing. MaxYield™'s automated noise reduction and adaptive algorithm streamline workflows, enabling healthcare providers to handle more information in less time.
These techniques not only improve the quality of heart ECG waves but also enable healthcare providers to deliver timely and precise diagnoses, ultimately enhancing outcomes in cardiovascular care. By implementing these advanced techniques, healthcare providers can achieve more accurate diagnoses and improve patient outcomes in cardiovascular care. For individuals keen on discovering these advanced features, Neural Cloud Solutions Inc. provides free trials and tailored walkthroughs of MaxYield™ and its customizable visualization tool, Insight360, which converts clean ECG information into interactive dashboards and clinical-ready reports.

Utilize Visualization Tools to Enhance ECG Data Interpretation
Misinterpretation of ECGs remains a significant challenge in clinical practice, highlighting the need for effective visualization tools. Here are some best practices for utilizing visualization tools:
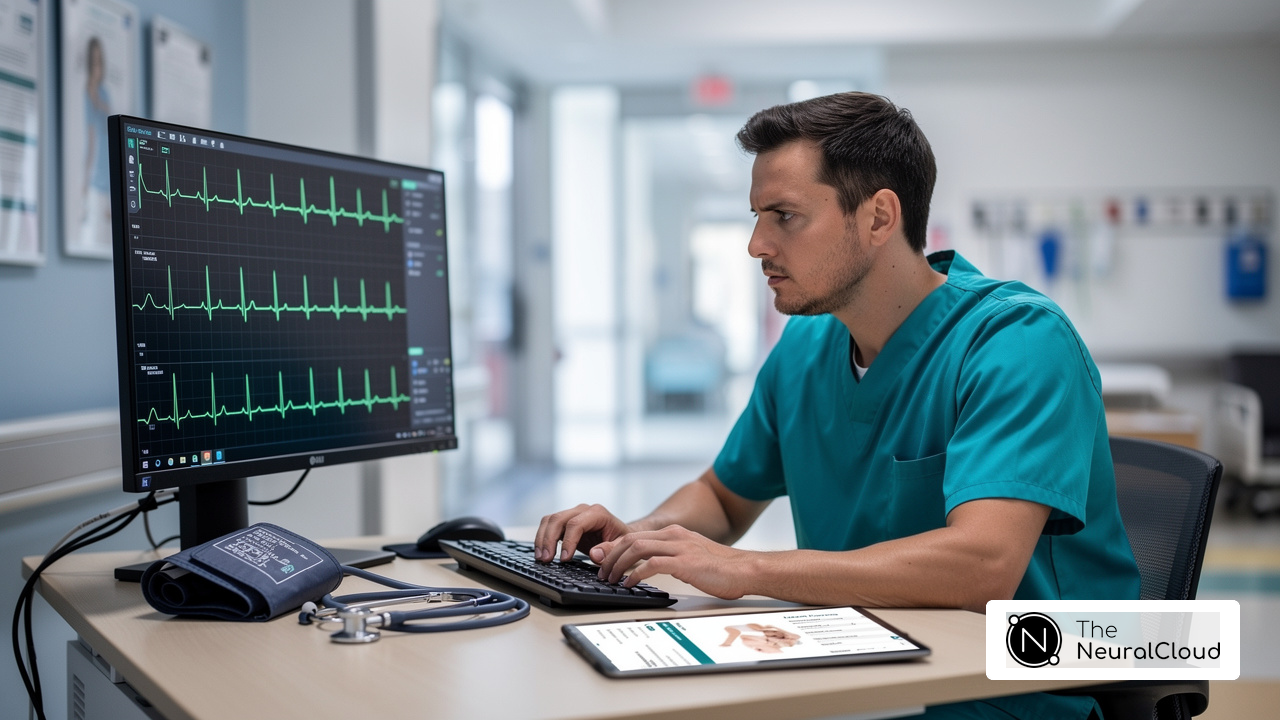
- Custom Dashboards: Develop dashboards that enable clinicians to view key metrics and trends at a glance. Tools like Insight360 can be configured to display relevant ECG parameters, facilitating continuous monitoring of patient status over time. Misinterpretation of ECGs remains a significant challenge, with nearly 39% being misread. This underscores the need for effective visualization tools to improve diagnostic accuracy. Utilize graphical representations of heart ECG waves, including annotated waveforms and trend graphs, to emphasize significant changes in heart activity. This approach aids in the rapid identification of abnormalities, which is crucial for timely interventions. Expert opinions, such as those from Dr. Bo Wang, highlight that effective visualization can enhance the reliability of ECG assessments.
- Interactive Tools: Implement interactive visualization tools that allow users to manipulate views, zoom in on specific segments, and compare multiple ECG recordings side by side. This interactivity allows for a closer look at the data, making it easier to understand and improving diagnostic accuracy. When you combine wearable technology with MaxYield, it makes collecting and analyzing information a breeze. Dr. Alan Rabinowitz emphasizes that MaxYield’s precision rivals human interpretation, significantly reducing noise in ECG recordings. Additionally, it is important to note that MaxYield is currently pending FDA Class II SaMD clearance, ensuring compliance with regulatory standards.
- Exportable Reports: Ensure that visualization tools can generate clinical-ready reports that summarize findings clearly and concisely. This capability is essential for effective communication with other healthcare providers, streamlining the decision-making process. Case studies on custom dashboards for ECG information visualization in Canada demonstrate successful implementations that have enhanced outcomes for individuals, particularly in cities like Toronto and Calgary.
By utilizing these visualization strategies and being mindful of common pitfalls, healthcare professionals can significantly enhance their ability to interpret ECG information and make informed clinical decisions, ultimately improving patient care outcomes. By leveraging MaxYield’s advanced AI technology, clinicians can achieve unprecedented clarity in ECG data, ultimately transforming patient care.

Integrate ECG Analysis Solutions into Existing Healthcare Workflows
Integrating heart ECG waves evaluation solutions into existing healthcare workflows can be challenging, yet it is essential for maximizing their benefits. Here are best practices to consider:
- Assess Current Workflows: Evaluate existing ECG workflows to identify enhancement opportunities. Mapping current processes can reveal bottlenecks and areas for improvement, ensuring that integration efforts are targeted and effective.
- Collaborate with Stakeholders: Engage all relevant stakeholders, including clinicians, IT staff, and administrative personnel. This collaboration ensures that the integration process addresses their needs and concerns, fostering buy-in and facilitating smoother transitions.
- Training and Support: Provide comprehensive training for staff on the new ECG evaluation tools and workflows. Ongoing support is essential to address challenges that may arise during the transition, ensuring that users feel confident and competent in utilizing the new technology, similar to how heart ECG waves help monitor heart health.
- Monitor and Evaluate: After integration, continuously monitor the performance of the ECG assessment solutions and gather user feedback. This practice helps identify areas for improvement and ensures that the technology meets its intended goals.
The MaxYield™ platform from Neural Cloud Solutions enhances the efficiency of heart ECG waves workflow by utilizing advanced noise filtering and automation. It highlights key components like P, QRS, and T Waves of heart ECG waves, which streamlines processes and enhances data handling. Expert endorsements from Dr. Alan Rabinowitz, Dr. Brett Heilbron, and Dr. Marc W. Deyell emphasize that MaxYield™ competes with human interpretation in precision while significantly minimizing noise, which is essential for accurate evaluation of heart ECG waves.
Statistics indicate that Canada's diagnostic electrocardiograph market is projected to grow from $147 million in 2025 to $226.2 million by 2030, reflecting a compound annual growth rate of 6.4% (MarketsandMarkets™). This growth underscores the importance of incorporating advanced solutions for heart ECG waves evaluation like MaxYield™, which is awaiting FDA Class II SaMD approval, into healthcare workflows to enhance diagnostic capabilities and improve outcomes for individuals.
By overcoming these integration challenges, healthcare organizations can unlock significant improvements in patient outcomes and workflow efficiency. Ultimately, the successful integration of MaxYield™ can transform the analysis of heart ECG waves, leading to better patient outcomes and more efficient healthcare operations.

Conclusion
Navigating the complexities of ECG analysis is essential for healthcare professionals dedicated to improving patient outcomes. By understanding the components of ECG waveforms, implementing advanced signal processing techniques, utilizing effective visualization tools, and integrating ECG analysis solutions into existing workflows, clinicians can significantly enhance their diagnostic capabilities. This article highlights how a structured approach to ECG interpretation can make a real difference, leading to more accurate diagnoses and timely interventions.
Key arguments presented include:
- The necessity of recognizing the distinct phases of the heart's electrical cycle
- The role of advanced technologies like Neural Cloud Solutions Inc.'s MaxYield™ in enhancing accuracy
- The value of visualization tools in preventing misinterpretation
Furthermore, the integration of these solutions into healthcare workflows is essential for maximizing their benefits, ensuring that clinicians can leverage the full potential of ECG analysis in their practice.
Effective ECG analysis is a critical aspect of ensuring patient safety and quality care. By embracing these best practices and advanced technologies, healthcare professionals can navigate the complexities of ECG interpretation with confidence, leading to better patient outcomes and enhanced safety in clinical settings. The call to action is clear: invest in training, adopt innovative solutions like MaxYield™, and commit to continuous improvement in ECG analysis to transform cardiac care in clinical settings.
Frequently Asked Questions
What are the main components of an ECG waveform?
The main components of an ECG waveform include the P wave, QRS complex, T wave, and occasionally the U wave. Each component represents distinct phases of the heart's electrical cycle.
What does the P wave indicate in an ECG?
The P wave indicates atrial depolarization, which is the electrical activation of the atria before contraction. Its morphology is important for recognizing atrial enlargement or rhythm disturbances.
What is the significance of the QRS complex in an ECG?
The QRS complex represents ventricular depolarization and is the most prominent feature of the ECG. Variations in its duration and morphology can indicate conditions such as bundle branch blocks or ventricular hypertrophy.
What does the T wave represent in an ECG?
The T wave reflects ventricular repolarization. Abnormalities in the T wave, such as inversion or flattening, can signal ischemia or electrolyte imbalances, which are critical for timely cardiac intervention.
What is the role of the U wave in an ECG?
The U wave, although not always visible, can indicate delayed ventricular repolarization and is often associated with conditions like hypokalemia or bradycardia, providing additional insights into cardiac health.
How does understanding ECG components influence clinical decisions?
Grasping the components of ECG waves is key to accurate interpretation, which can significantly influence clinical decisions and improve patient outcomes in healthcare settings.
What technology does Neural Cloud Solutions Inc. offer for ECG evaluation?
Neural Cloud Solutions Inc.'s MaxYield™ platform employs advanced noise filtering and distinct wave recognition capabilities to enhance the evaluation of heart ECG waves, ensuring critical data is not lost.
How does MaxYield™ improve the efficiency of healthcare professionals?
MaxYield™ helps healthcare professionals quickly separate heart ECG waves from recordings that may be muddled by noise or movement, ultimately leading to better results for individuals.
What is the regulatory status of MaxYield™?
MaxYield™ is currently pending FDA Class II SaMD clearance, ensuring compliance with regulatory standards, making it a reliable choice for clinicians in Canada.
Why is MaxYield™ particularly beneficial for clinicians in Canadian cities like Toronto and Calgary?
MaxYield™ enhances the ability of clinicians to navigate the complexities of ECG interpretation, which is essential for advanced cardiac care in Canadian healthcare settings.
List of Sources
- Understand ECG Waveform Components and Their Significance
- AI finds hidden ECG signal that predicts sudden cardiac death risk (https://scientificamerican.com/article/ai-finds-hidden-ecg-signal-that-predicts-sudden-cardiac-death-risk)
- Electrocardiography - Cardiology - Merck Manual Professional Edition (https://merckmanuals.com/professional/cardiovascular-disorders/cardiovascular-tests-and-procedures/electrocardiography)
- Understanding the PQRST Wave: A Guide to ECG Interpretation (https://baysidecpr.com/pqrst-wave-ecg-interpretation)
- PQRST Wave in ECG: Professional Interpretation Guide (https://cprvam.com/blog/pqrst-wave-in-ecg-interpretation)
- ECG interpretation: Characteristics of the normal ECG (P-wave, QRS complex, ST segment, T-wave) (https://ecgwaves.com/articles/ecg-normal-p-wave-qrs-complex-st-segment-t-wave-j-point)
- Implement Advanced Signal Processing Techniques for Accurate ECG Analysis
- The latest innovations in ECG technology and analysis - Norav Medical (https://noravmedical.com/advancements-in-ecg-technology-exploring-the-latest-innovations-in-ecg-analysis)
- ECG Noise Filtering Improves Clinical Accuracy (https://emjreviews.com/interventional-cardiology/news/ecg-noise-filtering-improves-clinical-accuracy)
- Advancements in ECG Technology and Signal Processing (https://medicalsearch.com.au/buying-guide/advancements-in-ecg-technology-and-signal-processing/f/24927)
- Utilize Visualization Tools to Enhance ECG Data Interpretation
- Harnessing AI to Decode the Heart | UHN Research (https://uhnresearch.ca/news/12-10-2025/harnessing-ai-to-decode-the-heart)
- New Trends in the ECG Monitoring (https://dicardiology.com/article/new-trends-ecg-monitoring)
- theneuralcloud.com (https://theneuralcloud.com/post/enhance-ecg-data-analysis-with-advanced-technologies-and-best-practices)
- theneuralcloud.com (https://theneuralcloud.com/post/master-ecg-chart-explained-steps-to-accurate-interpretation)
- Integrate ECG Analysis Solutions into Existing Healthcare Workflows
- PMcardio: AI ECG & Cardiac Care Platform (https://powerfulmedical.com)
- canada Diagnostic Electrocardiograph/ECG Market Size, Share,Trends, Growth Analysis Report, 2030 (https://marketsandmarkets.com/Market-Reports/geography/diagnostic-ecg-global-market/canada)
- Platform Advances AI-Driven ECG Analysis (https://healthmanagement.org/c/digital-transformation/News/platform-advances-ai-driven-ecg-analysis)
- Automated ECG Analysis Software Market Size, Share & Forecast Report 2025 to 2034 | Dataintelo (https://dataintelo.com/report/global-automated-ecg-analysis-software-market)
- Movesense and NeuralCloud to Pilot AI-Powered ECG and Holter Reporting — Movesense (https://movesense.com/news/2026/02/movesense-and-neuralcloud-to-pilot-ai-powered-ecg-and-holter-reporting)