Introduction
Many healthcare professionals struggle with the complexities of ECG interpretation, which can lead to misdiagnoses in a landscape where cardiovascular diseases are prevalent in Canada. With the advent of AI-driven tools like MaxYield from Neural Cloud Solutions Inc., clinicians can enhance their diagnostic capabilities, ensuring more accurate and timely assessments of heart health.
As these technologies evolve, healthcare providers may wonder how to effectively integrate AI into their ECG analysis workflows and what challenges they might face. This guide will explore how AI can streamline ECG analysis, ultimately enhancing diagnostic accuracy and improving patient outcomes.
Understand ECG Waveform Components
Understanding the key components of the ECG waveform is essential for learning how to interpret ECG results accurately, especially given the challenges posed by noise and artifacts. The primary elements include:
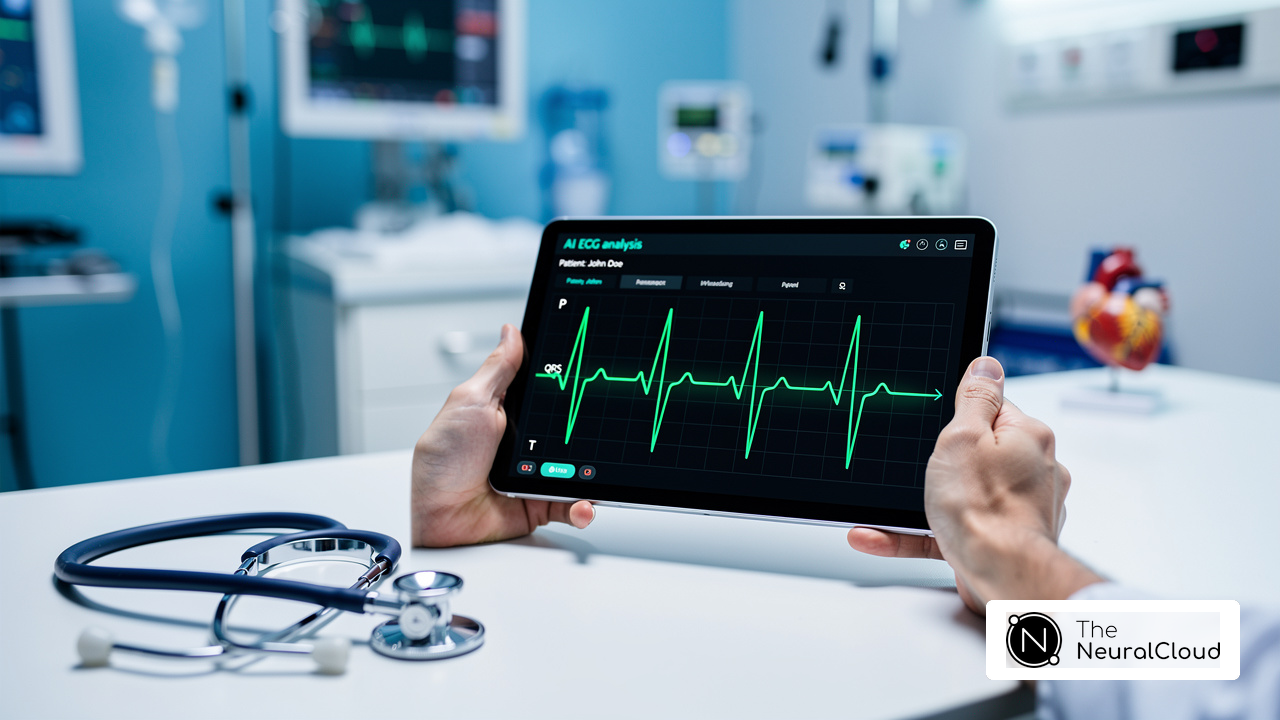
- P Wave: This wave represents atrial depolarization, indicating the electrical activity that triggers atrial contraction. It is essential for assessing atrial function and rhythm.
- QRS Complex: Reflecting ventricular depolarization, the QRS complex is vital for ventricular contraction. It consists of three components: the Q phase (initial downward deflection), the R phase (upward deflection), and the S phase (subsequent downward deflection). Accurate interpretation of the QRS complex is critical for diagnosing various cardiac conditions.
- T Wave: This signal indicates ventricular repolarization, the process by which the ventricles recover after contraction. Irregularities in the T component can indicate problems such as ischemia or electrolyte imbalances.
- U Wave: Occasionally present, the U wave may represent repolarization of the Purkinje fibers or other aspects of cardiac recovery. Its significance is still under investigation, but it can provide additional insights into cardiac health.
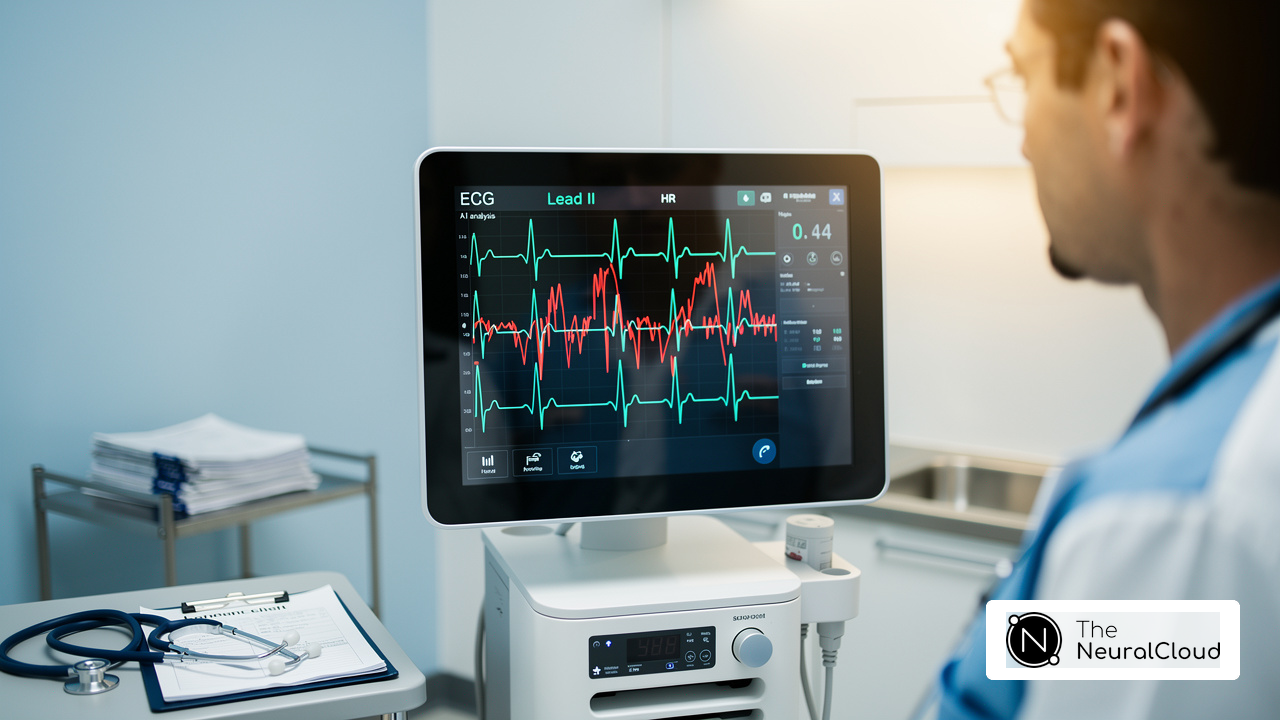
Grasping these elements lays the groundwork for understanding cardiac electrical function, which is vital for knowing how to interpret ECG results further. Recent advancements in AI-driven ECG analysis, particularly through Neural Cloud Solutions Inc.'s MaxYield platform, have significantly enhanced the ability to identify and interpret these waveform components. With MaxYield's advanced noise filtering, clinicians can isolate critical data even in recordings plagued by noise and artifacts. This ensures that previously obscured sections of lengthy Holter and patch monitor recordings can be salvaged. Additionally, MaxYield delivers beat-by-beat analysis, outputting an analysis of 200,000 heartbeats in less than 5 minutes, leading to improved diagnostic accuracy and patient outcomes in cardiovascular care. Regulatory compliance details, including FDA Class II SaMD clearance-pending status, further bolster the credibility of this technology. Expert insights from Dr. Alan Rabinowitz, Dr. Brett Heilbron, and Dr. Marc W. Deyell highlight that MaxYield's precision competes with human analysis, making it an invaluable tool for clinicians. Furthermore, the integration of Insight360 as a customizable visualization and reporting tool transforms MaxYield’s clean ECG data into interactive dashboards and clinical-ready reports, optimizing patient care. By leveraging MaxYield's capabilities, healthcare professionals can enhance their diagnostic processes and ultimately improve patient care outcomes.

Follow a Systematic Approach to ECG Interpretation
To interpret ECG results accurately, follow this systematic approach:
- Assess the Quality of the ECG: Ensure the tracing is clear and free from artifacts. Poor quality can lead to misinterpretation. Studies show that 21% of ECGs corrected to normal QTc when Fridericia's formula was applied, highlighting the importance of accurate initial readings. MaxYield™ improves this process with advanced noise filtering, helping to recover obscured sections from Holter, 1-Lead, and patch monitor recordings.
- Determine the Heart Rate: Count the number of QRS complexes in a given time frame (e.g., 10 seconds) and multiply by 6 to find the beats per minute. This step is crucial, as knowing how to interpret ECG results can be significantly influenced by the heart rate.
- Evaluate the Rhythm: Check if the rhythm is regular or irregular by measuring the intervals between QRS complexes. A study indicated that the likelihood of being sent for an ECG at a high-ordering practice was 150% higher than at a low-ordering practice, underscoring the importance of rhythm evaluation in clinical settings.
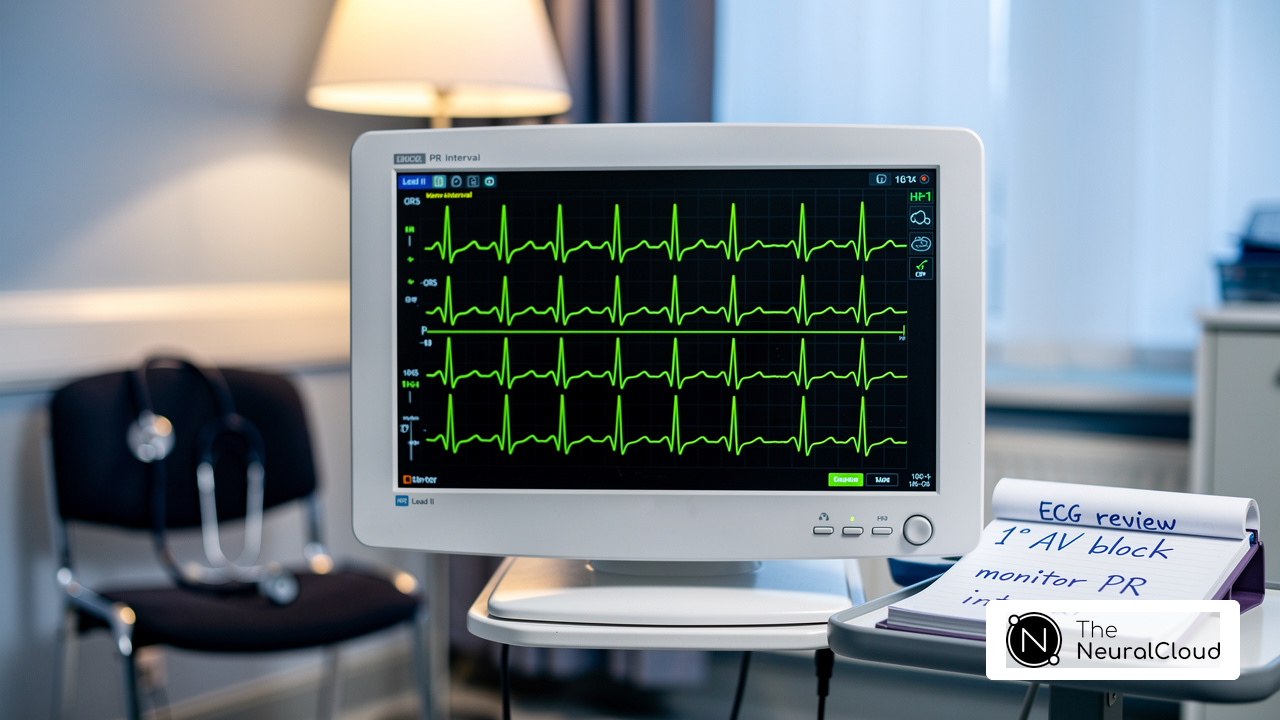
- Examine the P Oscillations: Look for the presence and shape of P oscillations before each QRS complex to assess atrial activity. The typical PR interval spans from 0.12 to 0.2 seconds (3-5 small boxes); irregularities in P shape morphology can suggest underlying atrial conditions that necessitate further examination.
- Examine the QRS Complex: Measure the duration and morphology of the QRS complex to identify any abnormalities in ventricular depolarization. Normal QRS duration ranges from 0.04 to 0.12 seconds; deviations may suggest conduction issues or other cardiac abnormalities.
- Assess the ST Segment and T Waves: Look for elevation or depression in the ST segment and analyze T wave morphology for signs of ischemia or other conditions. ST segment elevation of 1 mm or more in two or more contiguous leads is significant for diagnosing acute myocardial infarction.
- Integrate Findings: Combine all observations to create a comprehensive understanding, considering clinical context and patient history. Misinterpretation can occur if the ECG tracing is not clear, leading to potential diagnostic errors. This holistic approach guarantees thorough and accurate ECG interpretation, providing guidance on how to interpret ECG results in alignment with best practices in cardiovascular care. Eyad Talal Attar emphasized that precise ECG analysis significantly impacts the efficiency of clinical decision-making. Moreover, Dr. Alan Rabinowitz, Dr. Brett Heilbron, and Dr. Marc W. Deyell have endorsed MaxYield™ for its accuracy comparable to human analysis and its capacity to minimize noise, establishing it as an essential resource for healthcare professionals. Additionally, MaxYield™ is currently pending FDA Class II SaMD clearance, ensuring compliance with regulatory standards. The data processed by MaxYield™ can be visualized and reported through Insight360, a customizable tool that transforms clean ECG data into interactive dashboards and clinical-ready reports. With MaxYield™, healthcare professionals can trust that their ECG analyses are not only accurate but also efficient, ultimately benefiting patient care.

Identify Common ECG Abnormalities
Accurate diagnosis of ECG abnormalities is often hindered by noise and complexity in recordings, making it essential for healthcare professionals to have reliable tools at their disposal. Here are key abnormalities to identify:
- Atrial Fibrillation: This condition is characterized by an irregularly irregular rhythm and the absence of distinct P waves, indicating a risk for stroke and other complications. In Canada, the incidence of atrial fibrillation is up to 4.5% per year, and the lifetime risk of developing AF is estimated at 25% for individuals over 40 years of age. If AF is suspected post-stroke, 24 hours of rhythm-based monitoring is recommended. With MaxYield’s advanced noise filtering capabilities, clinicians can more accurately identify AF even in noisy recordings.
- Ventricular Tachycardia: Identified by a rapid heart rate with wide QRS complexes, this abnormality can signal a life-threatening condition requiring immediate intervention. MaxYield’s ability to salvage previously obscured sections of recordings enhances the detection of this critical condition.
- Myocardial Infarction: Look for ST segment elevation or depression, T wave inversions, and the presence of abnormal Q waves, which are critical indicators of heart tissue damage. The precision of MaxYield in transforming noisy ECG data into clear waveforms aids in timely diagnosis.
- Bundle Branch Block: Noted by a widened QRS complex, this finding suggests delayed conduction through the ventricles, which can impact cardiac function. The automated labeling features of MaxYield streamline the identification process for healthcare professionals.
- Long QT Syndrome: Prolonged QT intervals can lead to serious arrhythmias; accurate measurement of the QT interval is essential for patient safety. A 12-lead ECG is essential for confirming AF presence and evaluating baseline intervals. MaxYield’s evolving algorithm continuously improves its accuracy, ensuring reliable assessments.
With MaxYield, healthcare professionals can confidently navigate the complexities of ECG analysis, ultimately leading to better patient care and outcomes. As Dr. Alan Rabinowitz observes, 'MaxYield’s precision competes with human understanding, making it an invaluable tool in ECG analysis.' For those interested in exploring MaxYield further, Neural Cloud Solutions Inc. offers personalized walkthroughs and free trials.

Integrate AI Tools for Enhanced ECG Analysis
Integrating AI tools into ECG analysis presents both opportunities and challenges for healthcare professionals in Canada. To effectively enhance ECG analysis, consider the following steps:
- Select an AI-Powered ECG Tool: Choose a robust AI platform, like MaxYield™, that integrates seamlessly with your existing ECG systems. MaxYield™ acts as a versatile ECG intelligence layer, working with any device you have through API, SDK, or CDK, without needing hardware changes.
- Upload ECG Data: Input raw ECG recordings into the AI tool for analysis. Ensure that the data is clean and properly formatted to maximize the precision of the AI analyses.
- Review AI Interpretations: Analyze the AI-generated reports, which highlight rhythm abnormalities, ST segment changes, and other critical findings. MaxYield™ quickly labels P, QRS, and T Wave onsets, offsets, and time-series intervals, providing beat-by-beat tabulation in CSV format for easy integration into current workflows.
- Cross-Verify with Clinical Knowledge: Validate AI findings using your clinical expertise in ECG analysis, ensuring that the results align with established clinical expectations and practices.
- Utilize Visualization Tools: Leverage visualization features, such as Insight360, to create customizable dashboards and reports that enhance data understanding and presentation. Insight360 transforms MaxYield™’s clean ECG data into interactive dashboards and clinical-ready reports.
- Stay Updated on AI Developments: Regularly review advancements in AI technology to continuously enhance your ECG analysis capabilities, ensuring you remain at the forefront of diagnostic innovation.
By bringing AI tools into your practice, you can boost the precision and efficiency of ECG analyses like never before. This not only enhances diagnostic capabilities but also leads to better patient care outcomes, particularly in Canada, where cardiovascular diseases affect a significant portion of the population. Approximately 1.6 million Canadians are living with heart disease, highlighting the urgent need for effective diagnostic tools. By adopting these practices, healthcare providers can better navigate the complexities of ECG analysis and improve overall patient management.
Additionally, consider the challenges facing ECG Interpretation AI adoption, such as algorithmic bias and integration complexities with existing systems. Addressing these challenges is essential for harnessing the full potential of AI in improving patient outcomes in cardiovascular care. As the ECG Interpretation AI market is projected to reach $7.6 billion by 2034, growing at a CAGR of 17.3%, the importance of adopting AI tools in ECG analysis cannot be overstated. Incorporating insights from successful case studies, such as the Queen of Hearts model's FDA authorization, can further demonstrate the effectiveness of AI tools in clinical practice. Expert endorsements from Dr. Alan Rabinowitz, Dr. Brett Heilbron, and Dr. Marc W. Deyell emphasize MaxYield™’s precision rivaling human interpretation and its noise reduction benefits, reinforcing the value of these innovative solutions.

Conclusion
As cardiac diagnostics grow increasingly complex, mastering ECG interpretation becomes essential for healthcare professionals. Understanding the fundamental components of the ECG waveform and using a systematic approach can significantly enhance diagnostic accuracy. AI-driven tools like MaxYield from Neural Cloud Solutions Inc. empower healthcare providers to navigate ECG interpretation with precision and efficiency.
Throughout the article, we shared key insights on:
- The essential elements of ECG waveforms
- The importance of a structured interpretation process
- The identification of common abnormalities
The role of AI in improving ECG analysis was emphasized, showcasing how tools like MaxYield can streamline workflows, reduce noise, and provide rapid, accurate assessments. The endorsement of these technologies by experts underscores their potential to transform cardiovascular care in Canada, where timely and precise diagnostics are paramount.
As the landscape of ECG interpretation evolves, embracing AI tools is not just an option but a necessity for healthcare professionals aiming to improve patient outcomes. This necessity for AI tools highlights the urgency for healthcare professionals to adapt to new technologies. By leveraging the capabilities of platforms like MaxYield and Insight360, clinicians can ensure they remain at the forefront of diagnostic innovation. With the rise of AI, the future of ECG analysis looks promising, and the commitment to integrating advanced technologies will undoubtedly lead to enhanced patient care and better management of cardiovascular diseases across Canada.
Frequently Asked Questions
What are the key components of the ECG waveform?
The key components of the ECG waveform include the P Wave, QRS Complex, T Wave, and U Wave. The P Wave represents atrial depolarization, the QRS Complex reflects ventricular depolarization, the T Wave indicates ventricular repolarization, and the U Wave may represent repolarization of the Purkinje fibers.
What does the P Wave indicate in an ECG?
The P Wave indicates atrial depolarization, which is the electrical activity that triggers atrial contraction. It is essential for assessing atrial function and rhythm.
Why is the QRS Complex important in ECG interpretation?
The QRS Complex is vital for ventricular contraction and consists of three components: the Q phase (initial downward deflection), the R phase (upward deflection), and the S phase (subsequent downward deflection). Accurate interpretation of the QRS Complex is critical for diagnosing various cardiac conditions.
What does the T Wave represent in an ECG?
The T Wave represents ventricular repolarization, the process by which the ventricles recover after contraction. Irregularities in the T Wave can indicate issues such as ischemia or electrolyte imbalances.
What is the significance of the U Wave in an ECG?
The U Wave, which is occasionally present, may represent repolarization of the Purkinje fibers or other aspects of cardiac recovery. Its significance is still under investigation, but it can provide additional insights into cardiac health.
How does Neural Cloud Solutions Inc.'s MaxYield platform enhance ECG analysis?
MaxYield enhances ECG analysis through advanced noise filtering, allowing clinicians to isolate critical data even in recordings affected by noise and artifacts. It also provides beat-by-beat analysis, processing 200,000 heartbeats in less than 5 minutes, which improves diagnostic accuracy and patient outcomes.
What regulatory status does MaxYield hold?
MaxYield has FDA Class II SaMD clearance-pending status, which bolsters the credibility of the technology.
How does Insight360 complement MaxYield's capabilities?
Insight360 serves as a customizable visualization and reporting tool that transforms MaxYield’s clean ECG data into interactive dashboards and clinical-ready reports, optimizing patient care.
What expert insights support the effectiveness of MaxYield?
Experts such as Dr. Alan Rabinowitz, Dr. Brett Heilbron, and Dr. Marc W. Deyell highlight that MaxYield's precision competes with human analysis, making it an invaluable tool for clinicians in cardiovascular care.
List of Sources
- Understand ECG Waveform Components
- AI-ECG Momentum and Rising Competition Reshape Diagnostic Cardiology in 2026 (https://signifyresearch.net/insights/diagnostic-cardiology-market-bouncing-into-2026)
- 6 Trends In ECG Systems (https://dicardiology.com/article/6-trends-ecg-systems)
- Research study makes heart screening faster, more accessible using AI (https://hospitalnews.com/research-study-makes-heart-screening-faster-more-accessible-using-ai)
- AI finds hidden ECG signal that predicts sudden cardiac death risk (https://scientificamerican.com/article/ai-finds-hidden-ecg-signal-that-predicts-sudden-cardiac-death-risk)
- Follow a Systematic Approach to ECG Interpretation
- Retrospective Analysis of ECG Data Supports Cardiologists' Clinical Judgment (https://gehealthcare.com/en-us/insights/article/retrospective-analysis-of-ecg-data-supports-cardiologists-clinical-judgment?srsltid=AU7gw4U7L2ctmWvUz3HpMnHwwIj2ht59XcXoNE_PFOAKGxJEwkdDwpAg)
- 7.3 A Systematic Approach to Interpreting an ECG – Nursing Advanced Skills (https://wtcs.pressbooks.pub/nursingadvancedskills/chapter/7-3-a-systematic-approach-to-interpreting-an-ecg)
- ECGs Ordered After One in Five Annual Health Exams (https://tctmd.com/news/ecgs-ordered-after-one-five-annual-health-exams)
- ECG interpretation abilities in clinical practice: Examining the role of expertise, age, and gender - PMC (https://pmc.ncbi.nlm.nih.gov/articles/PMC12338287)
- Identify Common ECG Abnormalities
- What’s an EKG? (https://my.clevelandclinic.org/health/diagnostics/16953-electrocardiogram-ekg)
- Atrial Fibrillation - Cardio Guide (https://cardioguide.ca/atrial-fibrillation)
- Killer ECG Patterns: Part 1 (https://litfl.com/killer-ecg-patterns-part-1)
- Common ECG Abnormalities: Patterns and Clinical Context (https://mesimedical.com/insights/frequently-diagnosed-conditions-on-the-ecg)
- Integrate AI Tools for Enhanced ECG Analysis
- ECG market keeps evolving thanks to AI, home monitoring and Epic integration (https://signifyresearch.net/2026/02/13/ecg-market-keeps-evolving-thanks-to-ai-home-monitoring-and-epic-integration)
- FDA-cleared AI tool flags hidden heart disease from a standard ECG | Medical Economics (https://medicaleconomics.com/view/fda-cleared-ai-tool-flags-hidden-heart-disease-from-a-standard-ecg)
- ECG Interpretation AI Market Research Report 2034 (https://dataintelo.com/report/ecg-interpretation-ai-market)
- FDA Clears First AI-ECG Model for Acute MI Detection (https://tctmd.com/news/fda-clears-first-ai-ecg-model-acute-mi-detection)