Introduction
Many healthcare professionals struggle with ECG interpretation, a skill that is essential for effective cardiac care. This guide will help you master rhythm strips, giving you the tools to improve your diagnostic skills and patient outcomes. With misinterpretations common and serious consequences possible, how can you ensure accuracy in ECG interpretation?
Understand the Basics of Rhythm Strips
While rhythm strips are essential tools in diagnosing cardiac conditions, many healthcare professionals struggle with how to read a rhythm strip accurately. Let’s explore the key components that are crucial for accurate ECG interpretation:
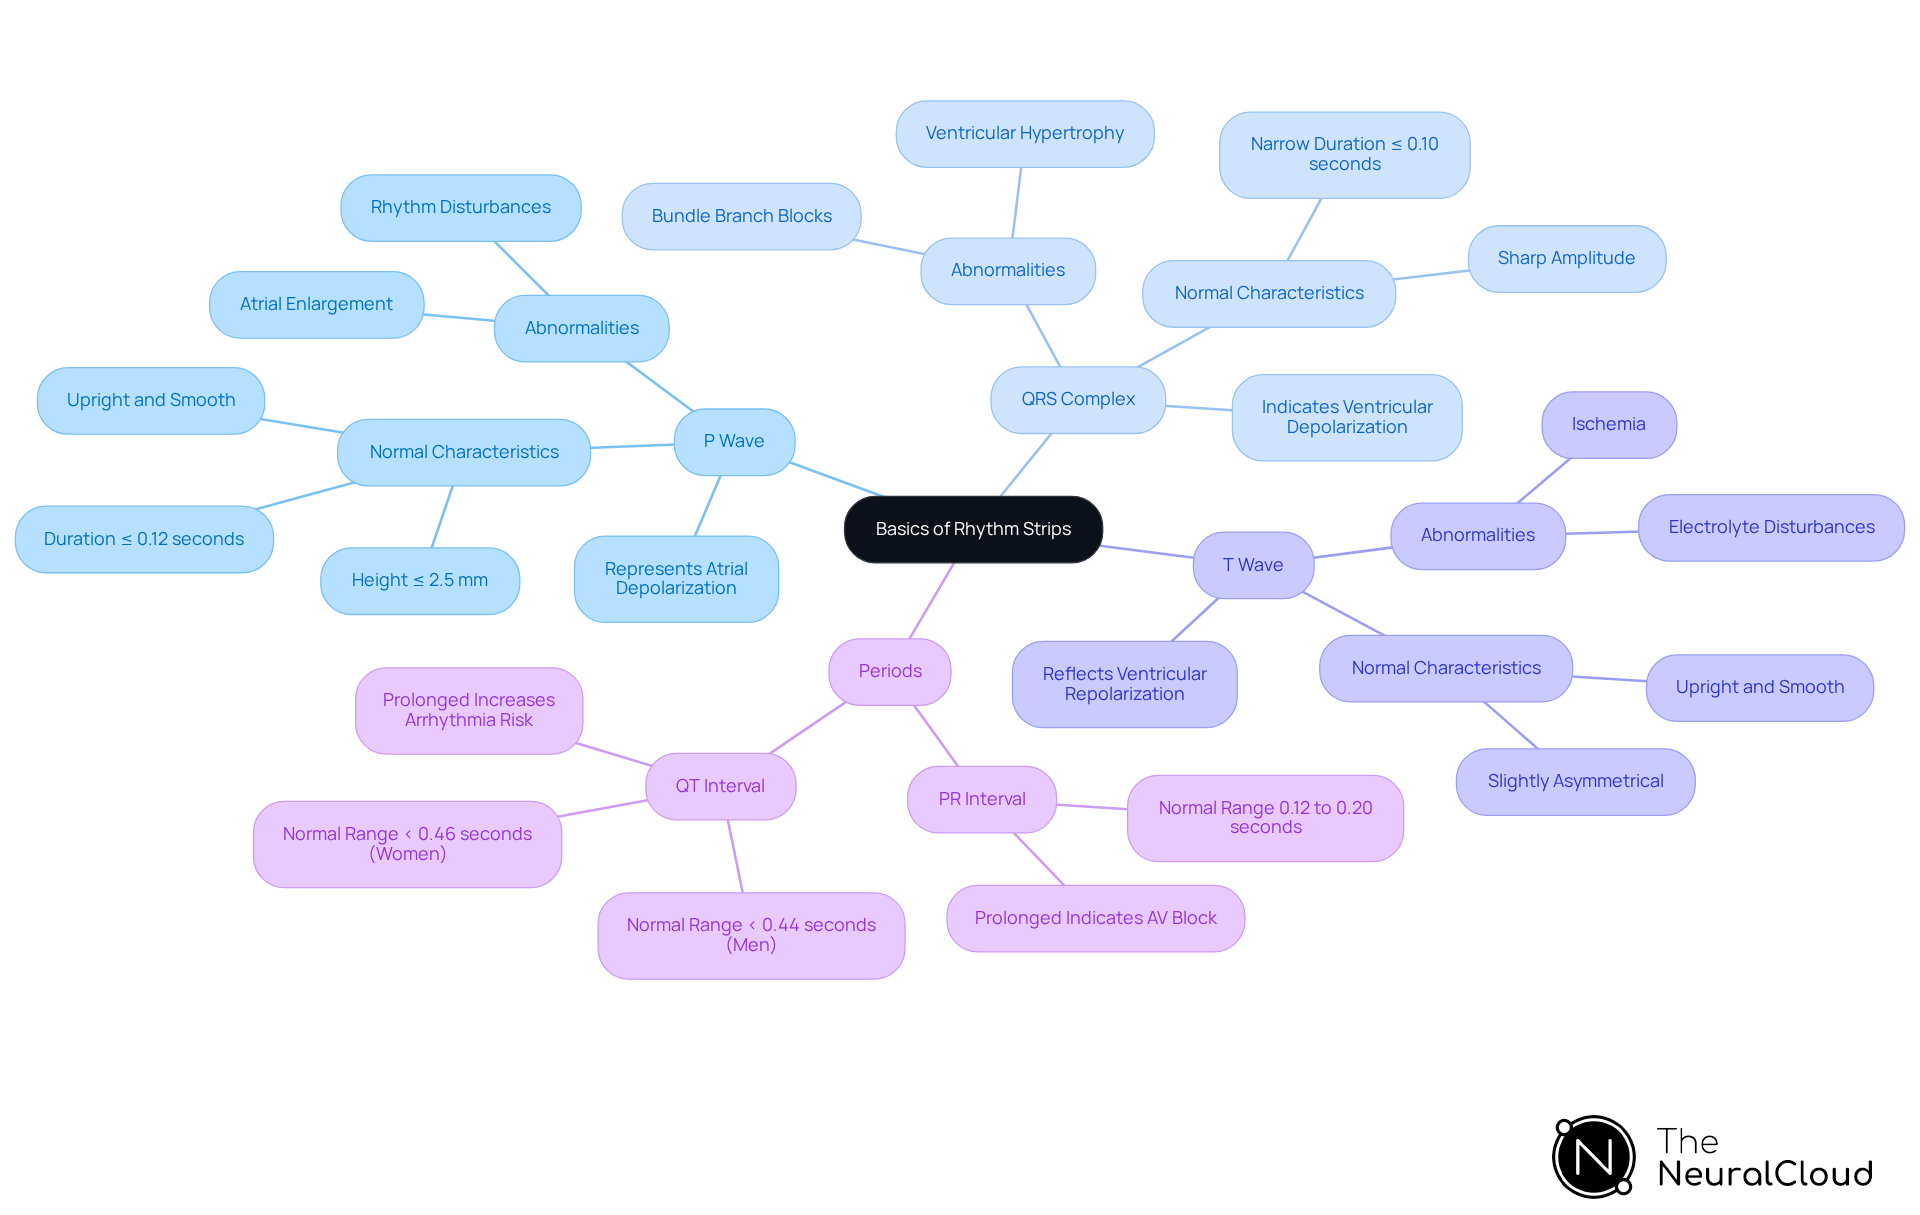
- P Wave: This wave represents atrial depolarization and should be upright, preceding each QRS complex. Irregularities in the P component can suggest atrial enlargement or rhythm disturbances.
- QRS Complex: This complex indicates ventricular depolarization and is usually narrow, occurring after each P signal. Variations in the QRS morphology can suggest underlying cardiac issues, such as bundle branch blocks or ventricular hypertrophy.
- T Wave: Reflecting ventricular repolarization, the T signal should be upright in most leads. Abnormal T shape patterns can indicate ischemia or electrolyte disturbances, making their assessment critical.
- Periods: Important periods consist of the PR period, which gauges the duration from the beginning of the P crest to the onset of the QRS complex, and the QT period, which extends from the start of the QRS complex to the conclusion of the T crest. Normal PR intervals range from 0.12 to 0.20 seconds, while QT intervals vary with heart rate but are generally < 0.44 seconds in men and < 0.46 seconds in women.
Recent advancements have shed light on how these components play a pivotal role in cardiac diagnostics. For instance, the morphology of the P wave can provide insights into atrial health, while the QRS complex's duration is critical for assessing conduction system function. Case studies have shown that recognizing changes in these waveforms is vital for diagnosing conditions like myocardial infarction and atrial fibrillation. Statistics indicate that up to 20% of Q-wave infarctions may occur without symptoms, underscoring the necessity of thorough ECG interpretation. By deepening their understanding of these ECG components, healthcare professionals can significantly enhance their diagnostic capabilities and ultimately improve patient care.
Interpret Rhythm Strips Step-by-Step
Interpreting ECGs accurately is crucial for effective patient care, yet many healthcare professionals face challenges in this area. To interpret a rhythm strip effectively, follow these steps:
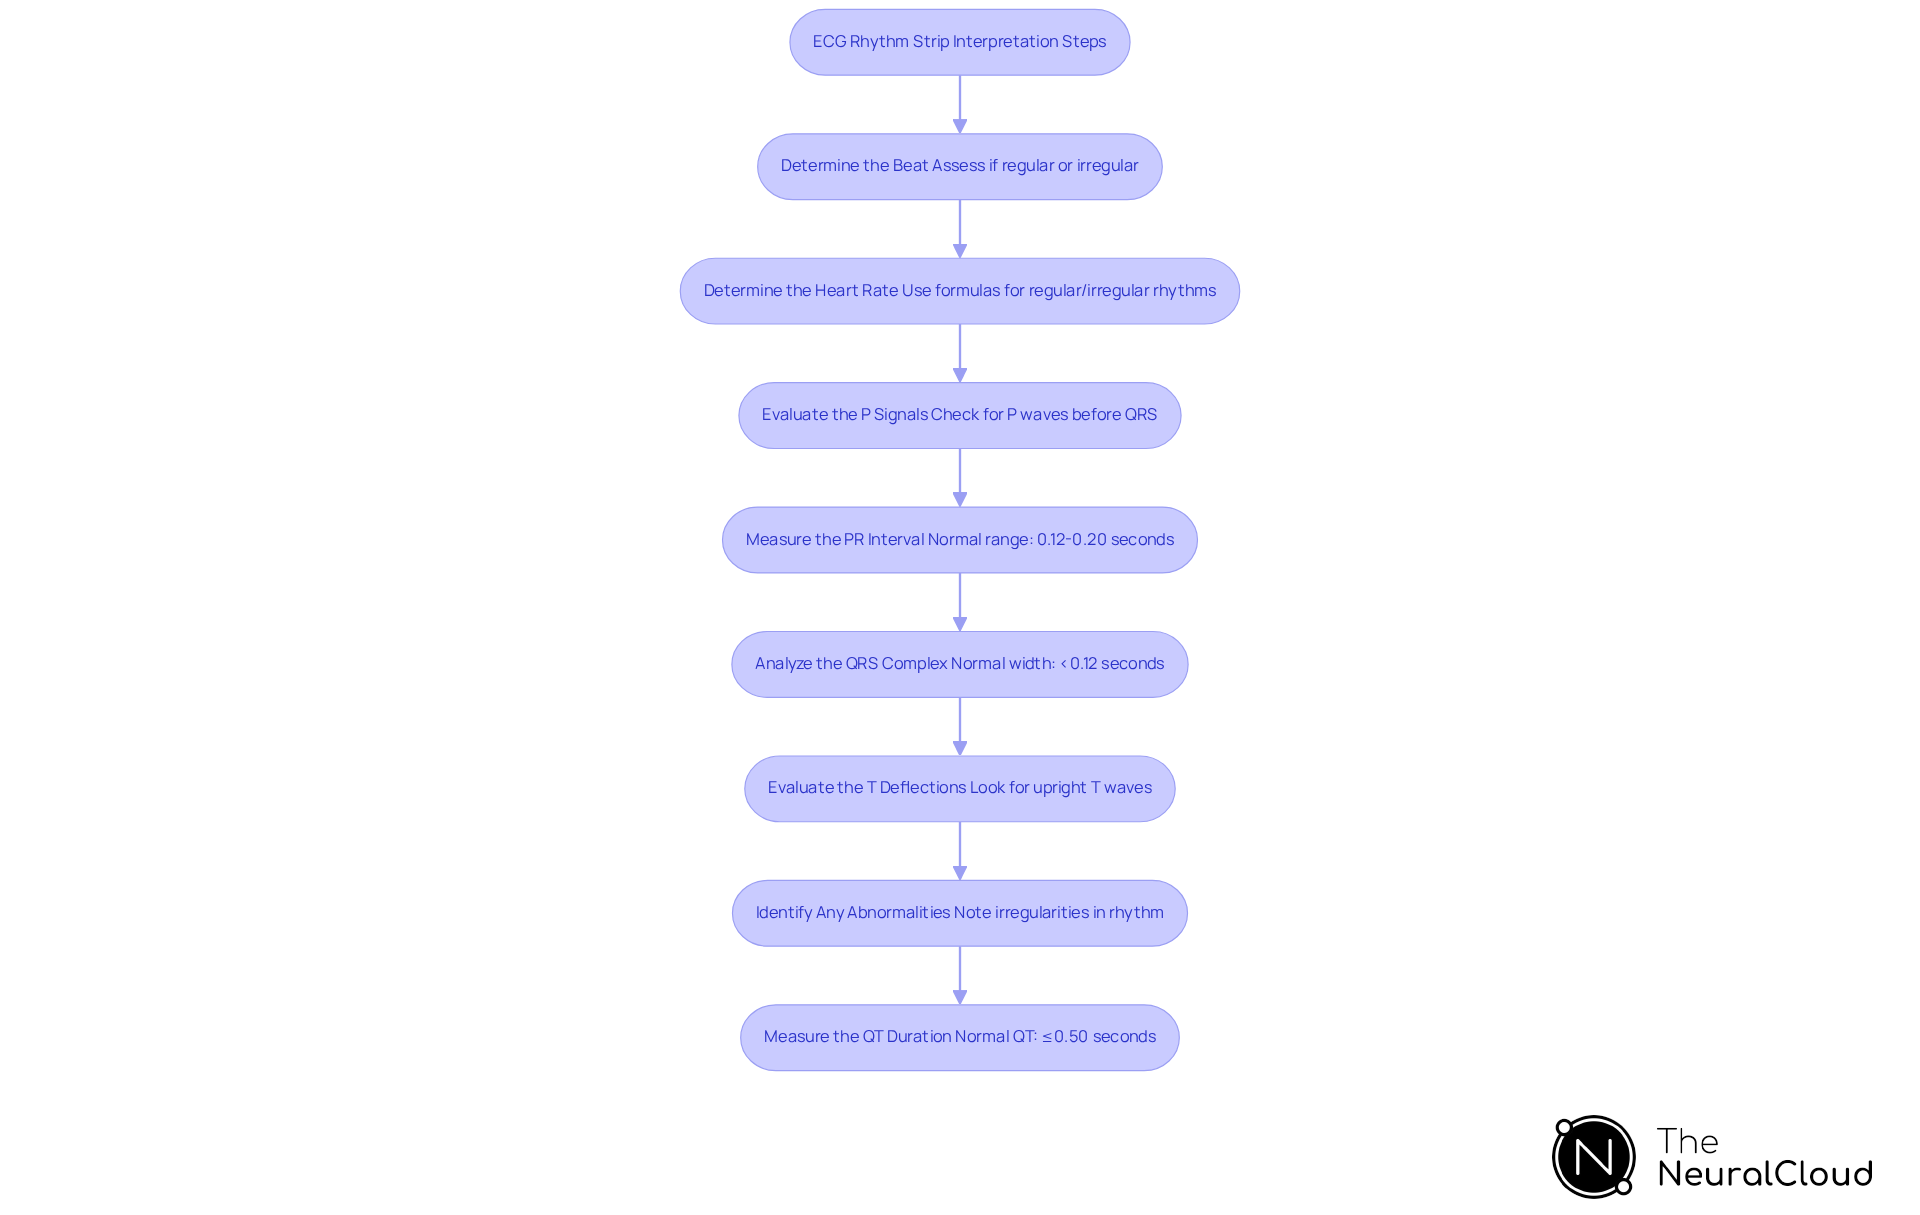
- Determine the Beat: Assess whether the beat is regular or irregular. A regular pattern has consistent intervals between R peaks, while an irregular pattern does not. About 70% of ECGs are recognized as regular, while 30% are irregular. This highlights the necessity for thorough assessment, as determining regularity is essential for precise diagnosis and treatment choices.
- Determine the Heart Rate: For a consistent pattern, apply the formula: Heart Rate = 300 / number of large squares between R peaks. For an irregular rhythm, count the number of R peaks in a 10-second strip and multiply by 6. This method provides an average heart rate over a ten-second period, converting it to beats per minute (bpm).
- Evaluate the P Signals: Check for the presence of P signals. Each P signal should precede a QRS complex. Studies show that about 27.7% of patients have normal P patterns, while 33.5% exhibit extensive P-pattern abnormalities, which may suggest atrial enlargement or other cardiac issues. This emphasizes the importance of thorough evaluation.
- Measure the PR Interval: Measure the distance from the start of the P wave to the start of the QRS complex. A typical PR duration ranges from 0.12 to 0.20 seconds. Abnormalities in this interval can indicate various degrees of AV block.
- Analyze the QRS Complex: Measure the width of the QRS complex. A normal width is less than 0.12 seconds. Wider complexes may indicate a conduction delay, such as a bundle branch block, which could be benign or a sign of underlying heart disease.
- Evaluate the T Deflections: Look for T deflections following each QRS complex. They should be upright and consistent in shape. Inverted T patterns may indicate ischemia or other cardiac conditions, requiring further investigation.
- Identify Any Abnormalities: Note any irregularities in the rhythm, such as premature beats or changes in wave morphology, which may indicate underlying cardiac issues. Systematic evaluation of these components is crucial for accurate diagnosis and treatment decisions.
- Measure the QT Duration: Although not always included, measuring the QT duration is essential. A normal QT interval should not exceed 0.50 seconds, as prolonged QT intervals are associated with significant risks, including arrhythmias and increased mortality rates.
Mastering these steps helps healthcare professionals understand how to read a rhythm strip and improve their ECG interpretation skills. This leads to better patient outcomes and more effective clinical decisions. Leveraging the advanced capabilities of Neural Cloud Solutions' MaxYield platform, including its gold standard noise filtering and automation features, can further streamline this process, allowing for more accurate and efficient ECG analysis. Additionally, the Insight360 tool provides customizable visualization and reporting capabilities, transforming clean ECG data into interactive dashboards and clinical-ready reports. It is important to note that the MaxYield platform is currently pending FDA Class II SaMD clearance, ensuring compliance with regulatory standards.
Analyze Key Components of the Rhythm Strip
Healthcare professionals often struggle with the complexities of ECG analysis, which can lead to misinterpretations and delayed diagnoses. When analyzing a rhythm strip, focus on the following key components:
- P Wave Characteristics: Ensure P waves are present and consistent. Tall, peaked P deflections in Lead II, defined as greater than 2.5 mm, may indicate right atrial enlargement or other issues. Irregularities in P shape morphology can indicate underlying conditions such as left atrial abnormality (LAA), which plays a significant role in the Romhilt-Estes score for left ventricular hypertrophy (LVH).
- QRS Complex Morphology: Examine the shape and duration of the QRS complex. A narrow QRS suggests a supraventricular origin, while a wide QRS may indicate a ventricular origin or conduction delay. Notably, marked evidence of right ventricular hypertrophy (RVH) may accompany these findings, particularly in cases of significant atrial enlargement.
- T Wave Assessment: Examine the T component for irregularities like inversion or flattening, which can suggest ischemia or electrolyte imbalances. Changes in T wave morphology can provide insights into the patient's cardiac health and potential underlying issues.
- Intervals and Segments: Pay attention to the PR and QT durations. Extended durations can indicate conduction blocks or other cardiac conditions. For instance, a prolonged QT interval may increase the risk of arrhythmias, necessitating further evaluation.
- Overall Beat Consistency: Evaluate the overall consistency of the beat. Irregular patterns may necessitate additional examination to identify the underlying cause. The prevalence of ECG findings increases with age, highlighting the importance of thorough analysis in older populations.
By including these components in your analysis, you can enhance how to read a rhythm strip and help ensure timely clinical decisions. Additionally, utilizing Neural Cloud Solutions' MaxYield™ platform can significantly improve this process. MaxYield™ automates ECG analysis, delivering beat-by-beat insights and effectively filtering noise to isolate critical data. With the ability to analyze 200,000 heartbeats in under 5 minutes, this advanced technology not only improves the clarity of ECG readings but also aids assured clinical decisions by offering detailed waveforms and time-series data for each heartbeat. Integrating MaxYield™ into your practice not only enhances the accuracy of ECG interpretations but also empowers healthcare professionals to make timely, informed decisions that can improve patient care.

Troubleshoot Common Issues in Rhythm Strip Interpretation
When analyzing ECG waveform strips, healthcare professionals often encounter several challenges that can complicate accurate interpretation. Here’s how to troubleshoot them effectively:
- Irregular Rhythm: If the rhythm appears irregular, double-check the R-R intervals. Use calipers or a ruler to measure intervals precisely, as irregular patterns are encountered in approximately 39.5% of ECG interpretations. The MaxYield™ platform aids in identifying these irregularities, enhancing diagnostic accuracy.
- Missing P Signals: If you notice missing P signals, it could indicate atrial fibrillation or other arrhythmias. Look for additional indicators, such as a rapid ventricular response, which is crucial for accurate diagnosis. MaxYield™ can assist in highlighting these features for better interpretation.
- Wide QRS Complex: A wide QRS complex might indicate a bundle branch block or a ventricular pattern. Confirm this by examining the morphology and duration of the QRS segment, as misinterpretations can lead to incorrect diagnoses, affecting patient care. The platform's noise filtering capabilities help clarify these segments.
- Inconsistent T Waves: If T waves show significant variation, assess for potential ischemia or electrolyte imbalances. Comparing with previous strips can provide context and enhance diagnostic accuracy. MaxYield™ supports this by providing a clean, neuralized signal for comparison.
- Artifact: Excessive noise or irregularities in the strip may indicate artifacts. Ensure proper electrode placement and check for patient movement or interference from nearby electronic devices, which can introduce consistent noise patterns. The MaxYield™ platform can assist in filtering out noise and enhancing ECG waveform recognition, improving the clarity of the readings and streamlining your workflow.
Recognizing these common issues and using effective troubleshooting techniques can significantly enhance your accuracy in rhythm strip interpretation. This ultimately leads to improved patient outcomes. Additionally, it is important to note that MaxYield™ is compliant with regulatory standards, ensuring its reliability in clinical settings. For a more comprehensive view of ECG data, consider utilizing Insight360, which transforms MaxYield’s clean ECG data into interactive dashboards and clinical-ready reports.

Conclusion
Interpreting ECG rhythm strips presents significant challenges for healthcare professionals, yet mastering this skill is crucial for effective patient care. Understanding the fundamental components of ECGs - like the P wave, QRS complex, and T wave - enables clinicians to interpret rhythm strips accurately and spot potential cardiac issues. This knowledge helps with timely diagnoses and empowers healthcare providers to make informed decisions that can greatly affect patient care.
Throughout this guide, key steps for interpreting rhythm strips have been outlined, including:
- Determining heart rate
- Evaluating P signals
- Measuring intervals
- Identifying abnormalities
Each step is crucial for a comprehensive analysis, as even minor irregularities can indicate serious underlying conditions. Additionally, leveraging advanced tools like Neural Cloud Solutions' MaxYield platform can streamline the interpretation process, providing enhanced clarity and efficiency in ECG analysis.
Ultimately, effectively reading rhythm strips is a vital skill that can improve patient management and outcomes. By committing to continuous learning and using innovative technologies, healthcare professionals can tackle the complexities of ECG interpretation, raising the standard of care in clinical practice.
Frequently Asked Questions
What are rhythm strips and why are they important?
Rhythm strips are essential tools used in diagnosing cardiac conditions. They help healthcare professionals accurately interpret the electrical activity of the heart.
What does the P wave represent in a rhythm strip?
The P wave represents atrial depolarization and should be upright, preceding each QRS complex. Irregularities in the P component can suggest atrial enlargement or rhythm disturbances.
What is indicated by the QRS complex in a rhythm strip?
The QRS complex indicates ventricular depolarization and is usually narrow, occurring after each P signal. Variations in the QRS morphology can suggest underlying cardiac issues, such as bundle branch blocks or ventricular hypertrophy.
What does the T wave reflect in a rhythm strip?
The T wave reflects ventricular repolarization and should be upright in most leads. Abnormal T shape patterns can indicate ischemia or electrolyte disturbances.
What are the important periods to assess in a rhythm strip?
Important periods include the PR period, which measures the duration from the beginning of the P wave to the onset of the QRS complex, and the QT period, which extends from the start of the QRS complex to the conclusion of the T wave. Normal PR intervals range from 0.12 to 0.20 seconds, while QT intervals are generally < 0.44 seconds in men and < 0.46 seconds in women.
How do advancements in ECG interpretation impact cardiac diagnostics?
Recent advancements have highlighted the importance of the components of rhythm strips in cardiac diagnostics. For example, the morphology of the P wave can provide insights into atrial health, and the QRS complex's duration is critical for assessing conduction system function.
Why is recognizing changes in waveforms important for healthcare professionals?
Recognizing changes in waveforms is vital for diagnosing conditions like myocardial infarction and atrial fibrillation. Statistics indicate that up to 20% of Q-wave infarctions may occur without symptoms, emphasizing the necessity of thorough ECG interpretation.
How can healthcare professionals improve their diagnostic capabilities?
By deepening their understanding of ECG components, healthcare professionals can significantly enhance their diagnostic capabilities and ultimately improve patient care.
List of Sources
- Understand the Basics of Rhythm Strips
- HRS Reports First Success of COMPASS Initiative for Early Atrial Fibrillation Care (https://hrsonline.org/news/compass-initiative-early-afib-care)
- ECG interpretation: Characteristics of the normal ECG (P-wave, QRS complex, ST segment, T-wave) – The Cardiovascular (https://ecgwaves.com/topic/ecg-normal-p-wave-qrs-complex-st-segment-t-wave-j-point)
- Understanding the PQRST Wave: A Guide to ECG Interpretation (https://baysidecpr.com/pqrst-wave-ecg-interpretation)
- Advances in detection of erratic heart rhythm (https://cordis.europa.eu/article/id/442633-advances-in-detection-of-erratic-heart-rhythm)
- ECG Case Studies | Interpretation & Answers | Geeky Medics (https://geekymedics.com/ecg-case-studies)
- Interpret Rhythm Strips Step-by-Step
- theneuralcloud.com (https://theneuralcloud.com/post/master-ecg-rhythm-identification-with-proven-best-practices)
- ECG Rhythm Evaluation (https://litfl.com/ecg-rhythm-evaluation)
- Electrocardiogram Interpretation in 10 Simple Steps (https://aclscertification.org/electrocardiogram-interpretation-in-10-simple-steps)
- ECG Rate Interpretation (https://litfl.com/ecg-rate-interpretation)
- Mastering EKG interpretation: 10 steps for accurate rhythm identification (https://ems1.com/ems-products/medical-monitoring/articles/ecg-interpretation-10-steps-for-rhythm-identification-HlbOvohuSltPKAL2)
- Analyze Key Components of the Rhythm Strip
- P-wave abnormalities (https://emcrit.org/ibcc/p)
- Troubleshoot Common Issues in Rhythm Strip Interpretation
- Mastering EKG interpretation: 10 steps for accurate rhythm identification (https://ems1.com/ems-products/medical-monitoring/articles/ecg-interpretation-10-steps-for-rhythm-identification-HlbOvohuSltPKAL2)
- theneuralcloud.com (https://theneuralcloud.com/post/10-key-artefact-ecg-issues-and-their-solutions)
- Troubleshooting Interpretive ECG Machines: Chronic Cardiac Care 2026 (https://selfimed.com/it/blogs/news/troubleshooting-interpretive-ecg-machines-chronic-cardiac-care?srsltid=AfmBOorSyjRmRuZdRim6UodasGIu54tEtkVDFPYUuEyesqCfX82EV_3m)
- Comprehensive Guide to Arrhythmias and Heart Rhythm Disorders (https://firstcoastheart.com/conditions/heart-rhythm-disorders)
- Frontiers | The most common errors in automatic ECG interpretation (https://frontiersin.org/journals/physiology/articles/10.3389/fphys.2025.1590170/full)