Introduction
Accurate ECG interpretation is essential for effective cardiovascular care, yet many healthcare professionals struggle with the complexities of analyzing Lead 1 readings. This tutorial explores advanced techniques that clarify normal Lead 1 ECG characteristics and improve diagnostic accuracy with tools like MaxYield. Clinicians want to improve patient outcomes, but how can they use technology to tackle common ECG analysis challenges and ensure accurate interpretations?
Define Normal ECG Characteristics
Accurate interpretation of ECG characteristics is crucial for effective cardiovascular care, yet many face challenges in achieving this precision. Let's explore the key components of normal ECG readings that MaxYield helps analyze effectively:
- Heart Rate: Typically ranging from 60 to 100 beats per minute (bpm), a healthy heart rhythm is vital. The heart beats around 100,000 times a day, underscoring the importance of monitoring this vital sign.
- Rhythm: A regular sinus rhythm originates from the sinoatrial node, characterized by consistent RR intervals, which is essential for assessing heart function.
- P Wave: This signal indicates atrial depolarization and is usually upright in leads I, II, and aVF. A normal P duration is between 0.06 to 0.12 seconds, with an amplitude not exceeding 2.5 mm.
- QRS Complex: Indicating ventricular depolarization, the QRS complex should have a duration of less than 0.12 seconds. Prolonged QRS duration can suggest underlying conditions such as bundle branch blocks or ventricular hypertrophy.
- T Waveform: Reflecting ventricular repolarization, the T waveform is typically upright in leads I, II, and V3-V6. The amplitude of the T wave should generally be less than 0.8 mV, with a duration between 0.1 seconds and 0.25 seconds.
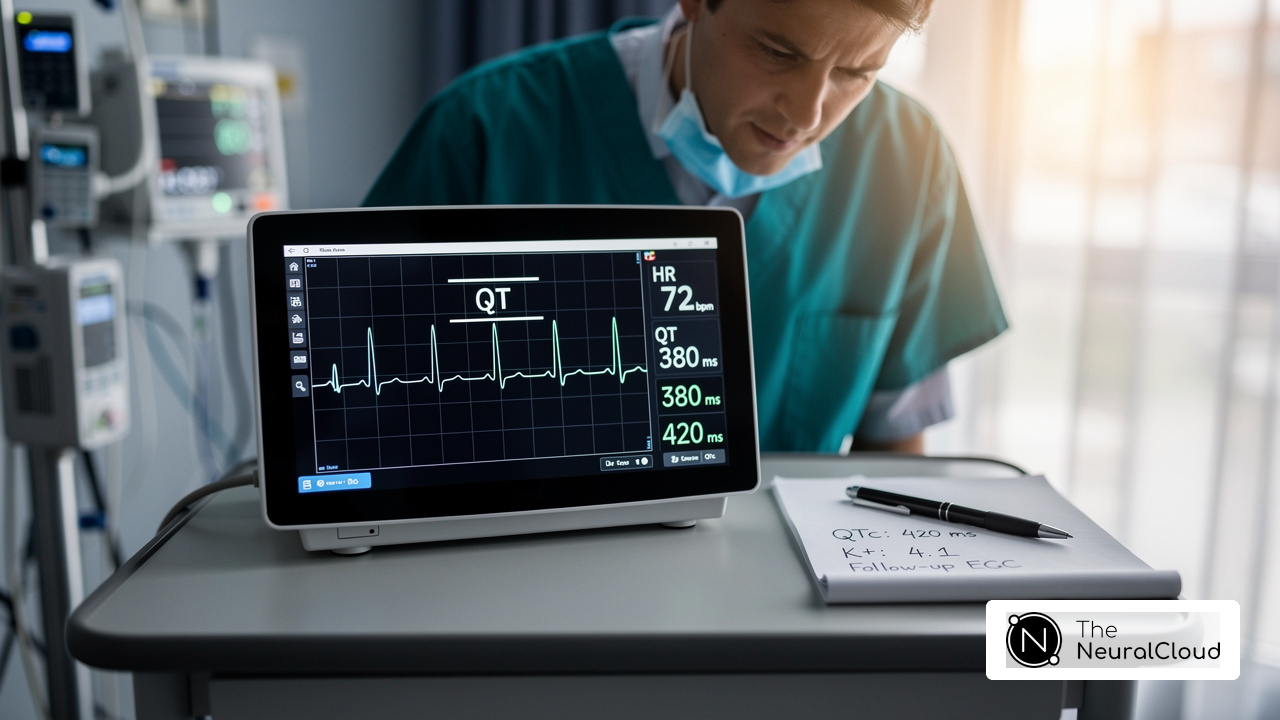
- Intervals: The normal PR interval ranges from 120 to 200 ms, while the corrected QT interval should be less than 440 ms for men and less than 460 ms for women.
Grasping these characteristics helps you tell the difference between normal lead 1 ECG readings and abnormal ECG readings, which is vital for effective patient care. Regular monitoring and analysis of these components can significantly enhance patient outcomes in cardiovascular care. False-positive rates for ECG assessments in athletes can complicate accurate diagnosis, making reliable tools essential. The International Criteria for ECG analysis, established in 2017, serve as the current standard of care for preparticipation ECG screening in young competitive athletes, emphasizing the importance of ongoing refinement in ECG evaluation criteria.
Experts like Dr. Alan Rabinowitz and Dr. Brett Heilbron endorse MaxYield for its precision, rivaling human interpretation and significantly reducing noise, which is crucial for healthcare professionals aiming for the highest standards in ECG analysis. Additionally, with FDA Class II SaMD clearance-pending status, MaxYield is designed to meet rigorous regulatory compliance, ensuring audit-ready documentation that supports GxP inspections. With expert endorsements, MaxYield not only enhances accuracy but also builds trust among healthcare professionals, positioning Neural Cloud Solutions Inc. as a leader in transforming ECG analysis with advanced AI for enhanced clarity and efficiency in healthcare.

Explore Key ECG Measurements and Intervals
Accurate cardiac assessment hinges on understanding key ECG measurements and intervals, which can often present challenges for healthcare professionals. Key measurements include:
- Heart Rate Calculation: This can be determined by counting the number of R waves in a 6-second strip and multiplying by 10, providing a quick estimate of the heart rate.
- PR Duration: Measured from the start of the P crest to the beginning of the QRS complex, the PR duration indicates the time taken for electrical conduction from the atria to the ventricles. Typical values vary from 120 to 200 milliseconds, with extended durations indicating possible conduction delays.
- QRS Duration: This reflects the time taken for ventricular depolarization, measured from the beginning to the end of the QRS complex. A normal QRS duration is less than 0.12 seconds (or less than 3 small squares on ECG paper), which is crucial for identifying various cardiac conditions.
- QT Duration: Indicating the total time for ventricular depolarization and repolarization, the QT duration is measured from the start of the QRS complex to the conclusion of the T crest. Normal values should be 420 milliseconds or less at a heart rate of 60 bpm, with prolonged intervals indicating potential risks for arrhythmias.
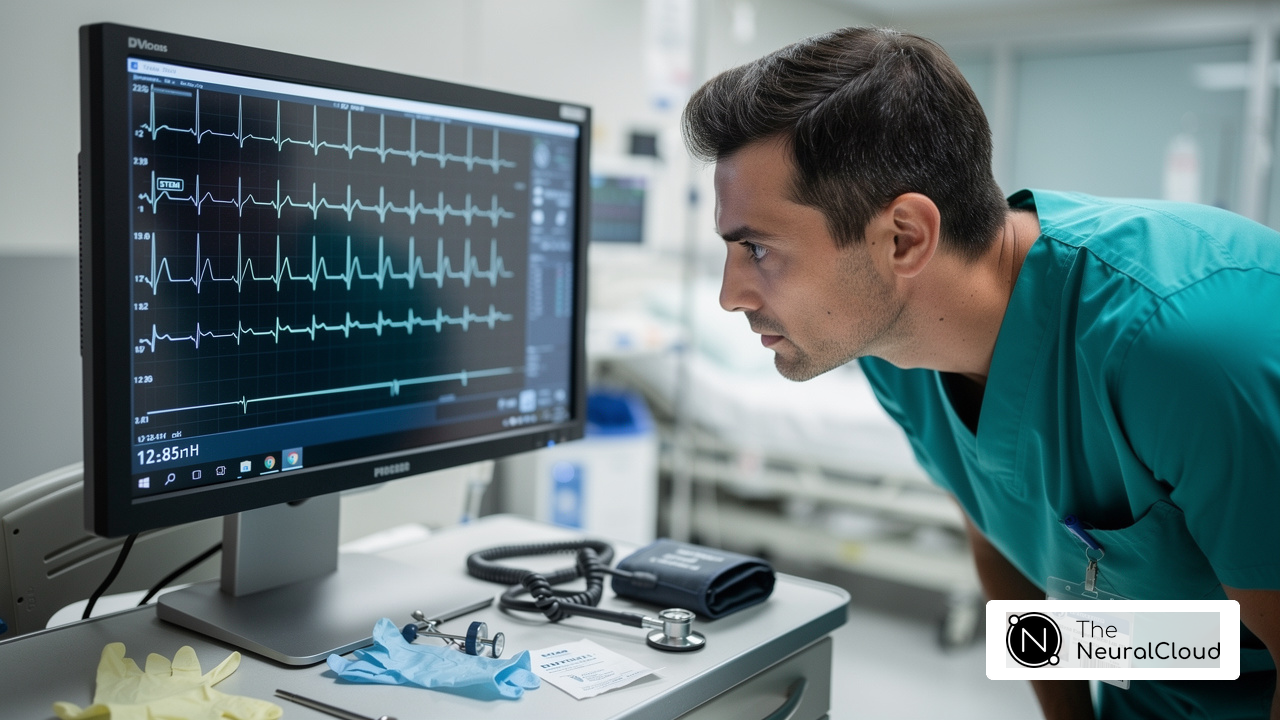
- ST Segment: This flat section between the end of the QRS complex and the beginning of the T wave is vital for assessing ischemia. Changes in the ST segment can indicate myocardial ischemia or infarction.
Grasping these measurements is essential for accurately interpreting the normal lead 1 ECG and diagnosing various cardiac conditions. In Canadian healthcare, accurate ECG interpretation is supported by studies showing that cardiologists agree with automated interpretations 98.7% of the time, underscoring the reliability of these measurements in clinical practice. Case studies, such as those involving prolonged PR intervals leading to AV block diagnoses, further illustrate the importance of these key ECG metrics in effective patient management.
Additionally, integrating MaxYield™ greatly enhances the efficiency of ECG analysis. MaxYield™ utilizes advanced noise filtering and unique signal recognition, enabling the swift isolation of ECG signals even in recordings affected by baseline wander and muscle artifacts. This capability not only salvages previously obscured sections of lengthy Holter and patch monitor recordings but also evolves with each use, continuously improving its accuracy and efficiency. As Dr. Alan Rabinowitz notes, "MaxYield™ rivals human interpretation in precision, making it an invaluable tool for clinicians."
Incorporating MaxYield™ into ECG analysis addresses the challenges of physiological variability and signal artifacts, ensuring that healthcare providers can rely on high-quality data for patient assessments. By leveraging MaxYield™, healthcare providers can ensure they are equipped with the most reliable data for effective patient management.

Interpret the Normal Lead 1 ECG: A Step-by-Step Guide
Accurate ECG interpretation is crucial, yet many healthcare professionals struggle with the complexities of Lead 1 analysis. To interpret the normal Lead 1 ECG using MaxYield™, follow these steps:
- Evaluate the Heart Rate: Count the number of R peaks in a 6-second strip and multiply by 10 to determine the heart rate, which should be between 60 to 100 beats per minute.
- Evaluate the Rhythm: Check for regularity by observing the spacing between R-R intervals. A regular rhythm indicates normal sinus rhythm.
- Examine the P Component: Ensure that each P component is present and upright, indicating normal atrial depolarization.
- Examine the QRS Complex: Confirm that the QRS duration is less than 0.12 seconds, indicating normal ventricular depolarization.
- Check the T Wave: The T wave should be upright in the normal lead 1 ECG, reflecting normal ventricular repolarization.
- Measure Periods: Calculate the PR duration (should be 120-200 ms) and QT duration (should be less than 400 to 440 milliseconds, corrected for heart rate).
- Look for Abnormalities: Identify any deviations from the normal characteristics, such as abnormal waveforms or intervals, which may indicate underlying cardiac issues.
This systematic approach helps healthcare professionals understand Lead 1 better, leading to accurate diagnoses. In Canadian medical practice, adherence to these steps is essential for effective ECG analysis, as it aligns with the standards set by local cardiovascular care guidelines. Comprehending cardiac anatomy and the electrical conduction system is essential for precise ECG analysis, as mistakes in evaluation can result in misdiagnosis and postponed treatment. Dr. Alan Rabinowitz points out that understanding cardiac physiology can really enhance the analysis process and lead to better patient outcomes. With MaxYield™, healthcare professionals can leverage advanced AI-driven ECG analysis and X-Factor signal mapping for enhanced clarity and diagnostic yield, revolutionizing the way ECGs are interpreted. Additionally, MaxYield™ is compliant with FDA Class II SaMD clearance-pending status, ensuring regulatory adherence. The integration of Insight360 as a customizable visualization tool further improves the analysis process, transforming clean ECG data into interactive dashboards and clinical-ready reports. MaxYield™ not only simplifies ECG interpretation but also empowers healthcare professionals to deliver timely and accurate diagnoses.

Utilize Advanced Tools for Enhanced ECG Analysis
Clinicians often face difficulties in accurately interpreting ECG data due to noise and complex patterns, making advanced tools essential for effective analysis. To enhance ECG analysis, consider utilizing the following advanced tools:
- AI-Powered ECG Software: Tools like MaxYield leverage artificial intelligence to improve signal processing, isolate noise, and enhance the clarity of ECG readings. This technology has shown significant improvements in diagnostic accuracy, with AI algorithms achieving up to 2x higher accuracy than conventional methods in peer-reviewed studies.
- Visualization Tools: Software such as Insight360 allows for customizable dashboards and reports, enabling clinicians to visualize trends and analyze data effectively. These tools facilitate better decision-making by presenting complex data in an accessible format.
- Automated Analysis Systems: These systems can quickly process ECG data, offering immediate assessments and alerts for unusual findings. The integration of AI in these systems enhances early detection and personalized treatment approaches for heart conditions, ultimately improving patient outcomes.
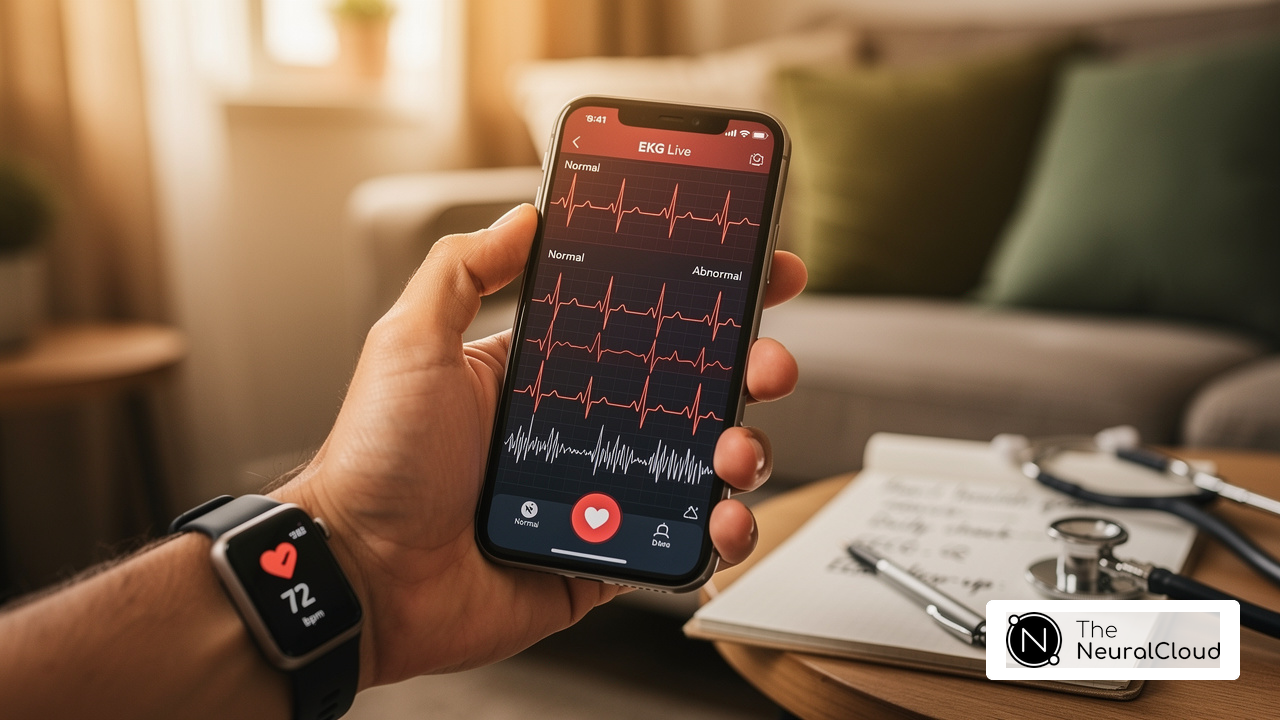
- Mobile Applications: Apps designed for ECG analysis can assist clinicians in examining ECGs on-the-go, providing instant feedback and recommendations. This flexibility supports timely interventions, especially in emergency settings.
- Training Simulators: Interactive platforms that replicate ECG readings can assist clinicians in practicing and enhancing their analysis skills in a risk-free environment. Such training tools are essential for improving the proficiency of healthcare professionals in ECG analysis.
Incorporating these advanced tools into clinical practice not only enhances the accuracy of ECG interpretation but also plays a crucial role in improving patient outcomes.

Conclusion
Mastering ECG interpretation is vital for healthcare professionals to ensure optimal cardiovascular care and patient outcomes. By understanding the key characteristics and measurements of ECGs, clinicians can enhance their diagnostic capabilities and improve patient outcomes. The integration of advanced tools like MaxYield™ and Insight360 empowers healthcare providers to boost their accuracy and efficiency in ECG analysis.
Throughout this tutorial, we highlighted critical components such as:
- heart rate
- rhythm
- P wave
- QRS complex
- T wave characteristics
along with the importance of measuring intervals like PR and QT. The step-by-step guide for interpreting Lead 1 ECG emphasizes the necessity of a systematic approach, ensuring that healthcare professionals can identify abnormalities and make informed decisions. Moreover, the role of AI-powered software and visualization tools in enhancing ECG analysis cannot be overstated, as they significantly improve diagnostic accuracy and streamline clinical workflows.
As the landscape of cardiovascular care continues to evolve, embracing advanced technologies and methodologies is crucial. By leveraging tools like MaxYield™ and Insight360, clinicians can refine their ECG interpretation skills and contribute to better patient management and outcomes. Embracing innovative technologies in ECG analysis will not only enhance diagnostic precision but also elevate the standard of care for patients in cardiovascular health.
Frequently Asked Questions
What are the key components of normal ECG readings analyzed by MaxYield?
The key components include heart rate (60 to 100 bpm), rhythm (regular sinus rhythm), P wave characteristics (upright in leads I, II, and aVF, duration of 0.06 to 0.12 seconds, amplitude not exceeding 2.5 mm), QRS complex (duration less than 0.12 seconds), T waveform (upright in leads I, II, and V3-V6, amplitude less than 0.8 mV, duration between 0.1 and 0.25 seconds), and intervals (PR interval of 120 to 200 ms, corrected QT interval less than 440 ms for men and 460 ms for women).
Why is accurate interpretation of ECG characteristics important?
Accurate interpretation is crucial for effective cardiovascular care, as it helps differentiate between normal and abnormal ECG readings, which is vital for patient care and outcomes.
What challenges do healthcare professionals face in ECG interpretation?
Many healthcare professionals face challenges in achieving precision in ECG interpretation, which can complicate accurate diagnosis, especially in athletes where false-positive rates can be high.
What is the significance of the International Criteria for ECG analysis established in 2017?
The International Criteria serve as the current standard of care for preparticipation ECG screening in young competitive athletes, highlighting the need for ongoing refinement in ECG evaluation criteria.
How does MaxYield enhance ECG analysis?
MaxYield enhances ECG analysis by providing precision that rivals human interpretation, significantly reducing noise, and ensuring audit-ready documentation that supports regulatory compliance.
What endorsements does MaxYield have from experts in the field?
Experts like Dr. Alan Rabinowitz and Dr. Brett Heilbron endorse MaxYield for its accuracy and effectiveness in ECG analysis, which builds trust among healthcare professionals.
What is the regulatory status of MaxYield?
MaxYield is currently pending FDA Class II SaMD clearance, ensuring it meets rigorous regulatory compliance standards.
List of Sources
- Define Normal ECG Characteristics
- ECG Intervals: Decoding P, QRS, And T Waves (https://dev.comewander.ca/comewander-news/ecg-intervals-decoding-p-qrs-and-t-waves-1767646699)
- Canadian Cardiologists Advocate Guidelines for Athlete Screening Before Sports Events | Newswise (https://newswise.com/articles/canadian-cardiologists-advocate-guidelines-for-athlete-screening-before-sports-events)
- Electrocardiography & cardiac function | Systems Design Engineering | University of Waterloo (https://uwaterloo.ca/systems-design-engineering/electrocardiography-cardiac-function)
- The International Criteria for Electrocardiogram Interpretation in Athletes: Common Pitfalls and Future Directions - PMC (https://pmc.ncbi.nlm.nih.gov/articles/PMC10292923)
- ECG Intervals: Understanding Normal P, QRS, And T Ranges (https://centos7-tor1-wh-04.webplanet.ca/webplanet-news/ecg-intervals-understanding-normal-p-qrs-and-t-ranges-1767646699)
- Explore Key ECG Measurements and Intervals
- The ECG: old test, new possibilities - Canadian Journal of Emergency Medicine (https://link.springer.com/article/10.1007/s43678-024-00822-0)
- PR Interval (https://litfl.com/pr-interval-ecg-library)
- Normal Duration Times - Normal Function of the Heart - Cardiology Teaching Package - Practice Learning - Division of Nursing - The University of Nottingham (https://nottingham.ac.uk/nursing/practice/resources/cardiology/function/normal_duration.php)
- Normal Electrocardiography (ECG) Intervals: Normal Electrocardiography Intervals (https://emedicine.medscape.com/article/2172196-overview)
- Interpret the Normal Lead 1 ECG: A Step-by-Step Guide
- Electrocardiogram - StatPearls - NCBI Bookshelf (https://ncbi.nlm.nih.gov/books/NBK549803)
- Memorable Cardiology Quotes | TheKnowHow Blog (https://theknowhow.ae/memorable-cardiology-quotes-heart)
- Electrocardiogram Interpretation in 10 Simple Steps (https://aclscertification.org/electrocardiogram-interpretation-in-10-simple-steps)
- Utilize Advanced Tools for Enhanced ECG Analysis
- PMcardio: AI ECG & Cardiac Care Platform (https://powerfulmedical.com)
- Investigating the Efficacy of AI-Powered Innovations in ECG Analysis and Continuous Heart Monitoring: A Comprehensive Narrative Review - PMC (https://pmc.ncbi.nlm.nih.gov/articles/PMC12419789)
- Artificial intelligence in ECG diagnostics - where are we now? (https://escardio.org/communities/councils/cardiology-practice/education/cardiopractice/artificial-intelligence-in-ecg-diagnostics-where-are-we-now)
- SEERS’ AI-powered wearable ECG monitor wins Health Canada approval (https://koreabiomed.com/news/articleView.html?idxno=33062)