Introduction
Navigating the complexities of cardiac diagnostics requires a solid understanding of normal EKG characteristics. This article delves into the defining features and standards of a normal electrocardiogram, highlighting its pivotal role in identifying heart conditions and ensuring effective patient care. Practitioners often face challenges in accurately interpreting EKG readings, which can lead to misdiagnosis. Accurate interpretation of EKGs is crucial for timely and effective patient care.
Define a Normal EKG: Key Features and Standards
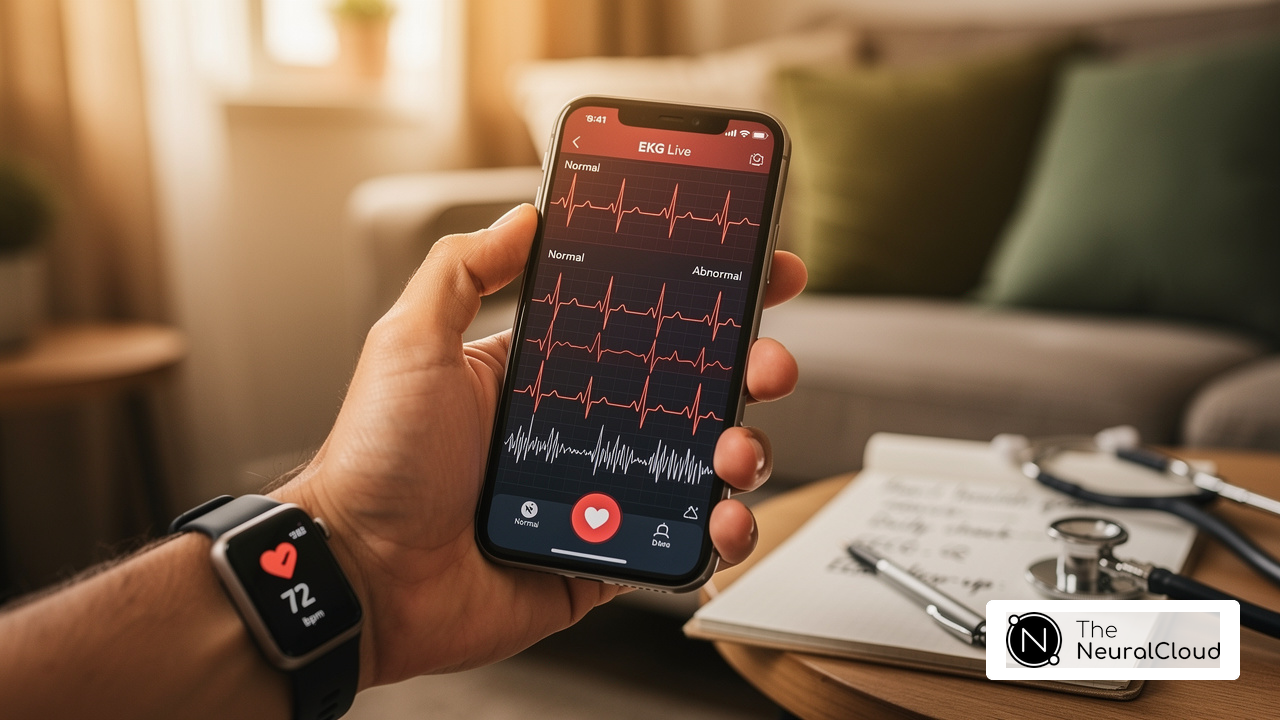
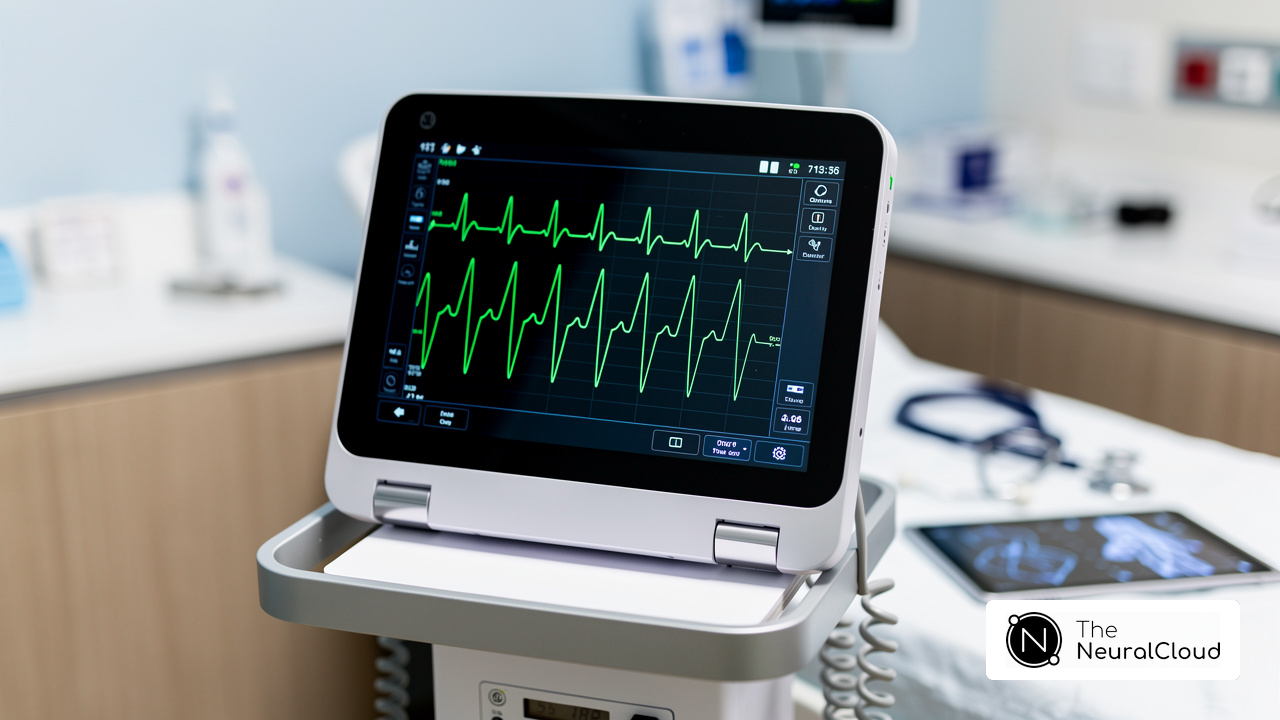
Interpreting EKGs can be challenging for healthcare professionals due to the complexity of heart rhythms and the potential for abnormalities. A typical EKG (electrocardiogram) acts as a graphical depiction of the organ's electrical activity, displaying a sequence of waves that relate to its electrical impulses. Key features of a normal EKG include:
- P Wave: Represents atrial depolarization, typically lasting about 80 milliseconds.
- QRS Complex: Indicates ventricular depolarization, which is part of what a normal EKG looks like, with a duration of 0.06 to 0.10 seconds. This complex consists of narrow, sharp spikes, essential for evaluating cardiac function.
- T Wave: Indicates ventricular repolarization, typically upright in most leads, and is essential for assessing what a normal EKG looks like during the organ's recovery phase.
- Heart Rate: Understanding what a normal EKG looks like indicates that a normal resting heart rate ranges from 60 to 100 beats per minute (bpm), with variations suggesting potential heart problems.
- Intervals: To determine what a normal EKG looks like, it is important to note the normal PR interval (120-200 milliseconds), QT interval (less than 440 milliseconds), and RR interval (0.6-1.2 seconds), which are vital for accurate heart assessment.
These standards help healthcare professionals accurately assess heart function and recognize what a normal EKG looks like to spot any abnormalities. For instance, the QRS complex morphology and the relationship of P waves to QRS complexes are crucial in diagnosing conditions such as atrial fibrillation and ventricular arrhythmias. Furthermore, the ability to detect noncardiac conditions, such as electrolyte imbalances, underscores the versatility of EKGs in clinical settings.
Neural Cloud Solutions' MaxYield solution tackles motion noise and ensures cross-device consistency, which enhances ECG data accuracy and makes the collected data reliable and actionable. Additionally, MaxYield is pending FDA Class II SaMD clearance, underscoring its compliance with regulatory standards. The integration of Insight360 as a customizable visualization and reporting tool transforms MaxYield’s clean ECG data into interactive dashboards and clinical-ready reports. As of 2026, adherence to these standards remains paramount for effective cardiovascular diagnostics, ensuring timely and appropriate patient care. With MaxYield's advanced algorithms, healthcare providers can expect reduced error variance in downstream models, leading to improved patient outcomes. With MaxYield, healthcare providers can navigate these complexities more effectively, ultimately leading to better patient care and outcomes.

Contextualize the Normal EKG: Importance in Cardiac Diagnostics
Interpreting EKGs accurately can be a daunting task, yet it is crucial for effective patient care. The standard EKG is an essential instrument in heart diagnostics, as it helps to determine what a normal EKG looks like while providing crucial insights into the heart's rhythm and electrical activity. It plays a vital role in identifying various cardiac conditions, such as arrhythmias, ischemia, and previous myocardial infarctions. By comparing a patient's EKG against recognized standard values, healthcare providers can identify deviations that may indicate health issues. For instance, abnormal EKG readings can signal atrial fibrillation or other rhythm disturbances, necessitating further investigation and intervention.
Did you know that nearly 200 million ECGs are performed annually? This statistic highlights the significance of understanding what a normal EKG looks like for effective diagnosis. Research shows that EKGs possess a sensitivity of 89% in identifying signs of heart failure, emphasizing their importance in early detection and management of heart problems. Furthermore, the integration of advanced technologies, such as AI-driven analysis, enhances the accuracy and efficiency of EKG interpretation. This innovation allows for the processing of over 200,000 heartbeats in less than five minutes. This speeds up workflows and helps healthcare professionals make timely decisions.
Case studies demonstrate the role of standard EKGs in diagnosing cardiac conditions. For instance, AI-powered ECG models automate the analysis of EKG data, significantly reducing interpretation times and improving diagnostic accuracy. This innovation enables the processing of over 200,000 heartbeats in under five minutes, streamlining workflows and facilitating prompt decision-making in clinical settings.
Expert insights highlight that understanding what a normal EKG looks like is crucial for determining which patients have an abnormal EKG. While a standard EKG offers reassurance, it does not ensure total cardiovascular health, requiring a comprehensive strategy that incorporates further tests for a complete evaluation. Ultimately, mastering EKG interpretation is essential for enhancing patient outcomes in cardiovascular care.

Explore the Evolution of EKG Technology: Historical Insights
Despite significant advancements in EKG technology, challenges in ECG analysis persist, impacting diagnostic accuracy. The evolution of EKG technology began in the late 19th century, marked by pivotal milestones that shaped its development.
- Augustus Desiré Waller recorded the first human electrocardiogram in 1887 using a capillary electrometer, laying the groundwork for future advancements.
- However, it was Willem Einthoven, often hailed as the father of electrocardiography, who transformed the field in 1903 with the invention of the string galvanometer. This innovative device made it possible to record the heart's electrical activity with greater accuracy and reliability, significantly enhancing diagnostic capabilities.
Building on earlier advancements, the introduction of 12-lead EKGs in the 1940s marked a significant leap forward, allowing for comprehensive evaluations of heart health. Throughout the decades, EKG technology has progressed from cumbersome, analog machines to sophisticated digital systems that offer improved precision and portability.
Today, innovations in artificial intelligence and machine learning, exemplified by Neural Cloud Solutions' MaxYield™, are further advancing EKG analysis. MaxYield™ features advanced noise filtering and automated signal processing, addressing challenges such as physiological variability and signal artifacts, which enhances workflow efficiency in ECG analysis.
Additionally, the data wall feature of MaxYield™ allows for the processing of more data in less time, while Insight360 transforms clean ECG data into interactive dashboards and clinical-ready reports. By addressing these challenges, these developments not only improve diagnostic accuracy but also enhance patient outcomes, making cardiac healthcare more accessible and efficient. By leveraging MaxYield™, healthcare professionals can navigate these challenges, ultimately enhancing patient care and outcomes.

Identify Key Characteristics of a Normal EKG: Waveforms and Intervals
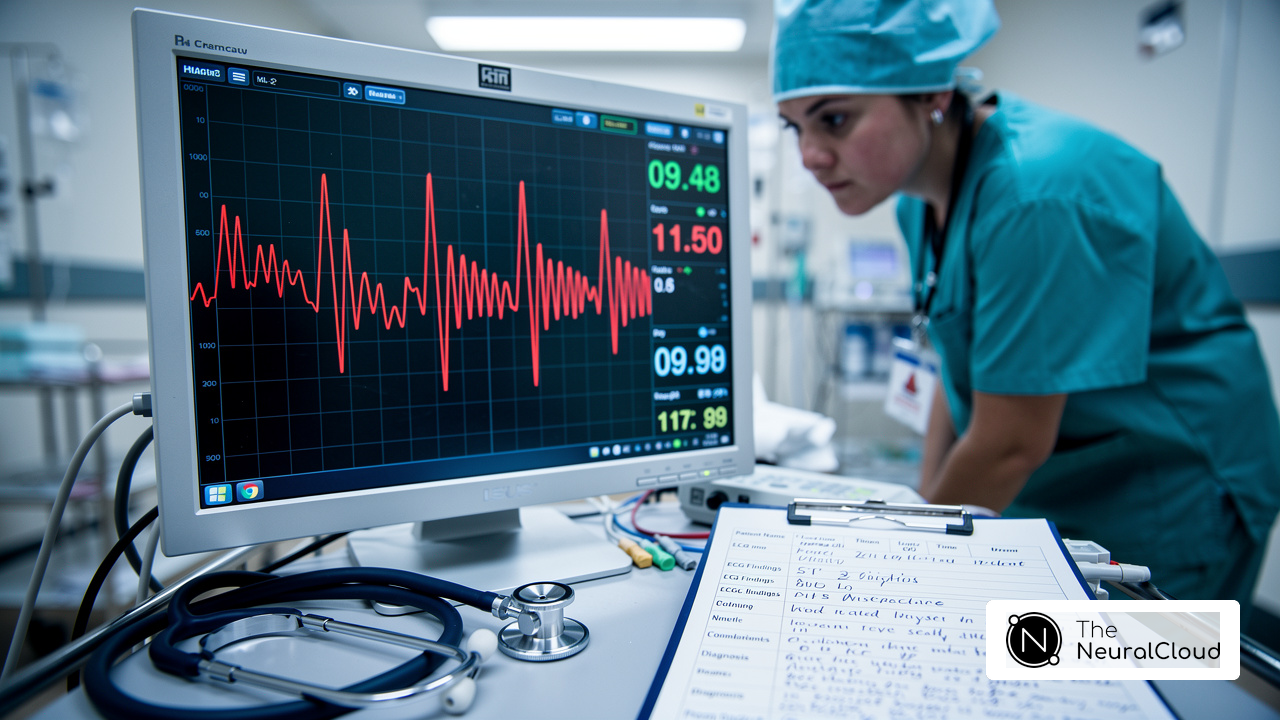
Accurate ECG analysis is crucial for identifying cardiac abnormalities, yet many healthcare professionals face challenges in interpreting complex waveforms effectively. A normal EKG comprises several key waveforms and intervals that reflect the heart's electrical activity, which can be effectively analyzed using the MaxYield™ platform:
- P Wave: This waveform indicates atrial depolarization and should appear smooth and rounded, with a duration of less than 0.12 seconds and an amplitude of less than 2.5 mm. The frontal plane P wave axis ranges from 0° to +75°.
- QRS Complex: Indicating ventricular depolarization, the QRS complex should be narrow and sharp, with a typical duration of 0.10 seconds or less. The typical QRS axis is between +90° and -30°.
- T Wave: This wave reflects ventricular repolarization and is typically upright in leads I, II, and V3-6, indicating slower conduction of the repolarization wave compared to the QRS complex.
- PR Interval: Measuring the time from the onset of the P wave to the beginning of the QRS complex, the typical range is between 0.12 and 0.20 seconds. A prolonged PR interval may indicate first-degree AV block.
- QT Interval: This interval indicates the total duration for ventricular depolarization and repolarization, with a typical duration of less than 0.450 seconds for men and less than 0.460 seconds for women. For a pulse rate of 70 bpm, the QT should be less than or equal to 0.40 seconds.
- RR Interval: The time between successive R waves, with a normal range of 0.6 to 1.2 seconds, is crucial for calculating heart rate, which typically ranges from 60 to 90 bpm.
Grasping these characteristics helps healthcare professionals accurately assess cardiac function and recognize what a normal EKG looks like to spot any abnormalities that might need further investigation. The MaxYield™ platform streamlines this analysis with automation and adaptability, enabling precise interpretations that save time and improve accuracy. Additionally, Insight360 serves as a customizable visualization and reporting tool that transforms MaxYield’s clean ECG data into interactive dashboards and clinical-ready reports. For instance, case studies have shown that recognizing variations in these waveforms can lead to timely interventions in conditions such as atrial flutter and ventricular fibrillation, ultimately improving patient outcomes. By leveraging the MaxYield™ platform, healthcare professionals can enhance their diagnostic capabilities, ultimately leading to better patient care and outcomes.

Conclusion
Understanding a normal EKG is not just beneficial; it's essential for effective cardiac diagnostics and patient care. A normal EKG is crucial for healthcare professionals, clearly showing the heart's electrical activity through distinct waveforms and intervals. By recognizing key features like the P wave, QRS complex, and T wave, clinicians can accurately assess heart function. Without recognizing these key features, clinicians may struggle to accurately assess heart function and identify potential abnormalities that may require further investigation.
This article has highlighted how important a normal EKG is for diagnosing cardiac conditions and the importance of adhering to established standards. The integration of advanced technologies, such as Neural Cloud Solutions' MaxYield, enhances the accuracy and efficiency of EKG interpretation. These advancements have made it easier for healthcare providers to navigate the complexities of cardiac health, allowing for timely decision-making in clinical settings.
In conclusion, mastering the interpretation of a normal EKG is crucial for improving patient outcomes in cardiovascular care. As the field of electrocardiography continues to evolve, embracing innovative solutions like MaxYield can empower healthcare professionals to deliver more accurate diagnoses and better patient care. By prioritizing the understanding of normal EKG standards, clinicians can significantly enhance their ability to address heart health issues, ultimately benefiting patient outcomes.
Frequently Asked Questions
What is an EKG and what does it represent?
An EKG (electrocardiogram) is a graphical depiction of the heart's electrical activity, displaying a sequence of waves that correspond to the organ's electrical impulses.
What are the key features of a normal EKG?
Key features of a normal EKG include the P wave (atrial depolarization), QRS complex (ventricular depolarization), T wave (ventricular repolarization), heart rate (60 to 100 beats per minute), and specific intervals (PR interval of 120-200 milliseconds, QT interval of less than 440 milliseconds, and RR interval of 0.6-1.2 seconds).
How long does the P wave last in a normal EKG?
The P wave typically lasts about 80 milliseconds.
What does the QRS complex indicate in an EKG?
The QRS complex indicates ventricular depolarization and has a duration of 0.06 to 0.10 seconds, consisting of narrow, sharp spikes that are essential for evaluating cardiac function.
What does the T wave represent in a normal EKG?
The T wave represents ventricular repolarization and is typically upright in most leads, indicating the heart's recovery phase.
What is the significance of heart rate in interpreting an EKG?
A normal resting heart rate ranges from 60 to 100 beats per minute, with variations suggesting potential heart problems.
Why are the intervals in an EKG important?
The intervals, such as the PR, QT, and RR intervals, are vital for accurate heart assessment and help healthcare professionals identify abnormalities.
How can EKGs help in diagnosing heart conditions?
EKGs can help diagnose conditions such as atrial fibrillation and ventricular arrhythmias by analyzing the morphology of the QRS complex and the relationship of P waves to QRS complexes.
What noncardiac conditions can EKGs detect?
EKGs can also detect noncardiac conditions, such as electrolyte imbalances, highlighting their versatility in clinical settings.
How does Neural Cloud Solutions' MaxYield enhance EKG data accuracy?
MaxYield tackles motion noise and ensures cross-device consistency, enhancing the accuracy of ECG data and making it reliable and actionable.
What is the status of MaxYield regarding regulatory compliance?
MaxYield is pending FDA Class II SaMD clearance, indicating its compliance with regulatory standards.
How does Insight360 contribute to the use of MaxYield?
Insight360 serves as a customizable visualization and reporting tool that transforms MaxYield’s clean ECG data into interactive dashboards and clinical-ready reports.
Why is adherence to EKG standards important for cardiovascular diagnostics?
Adherence to EKG standards is crucial for effective cardiovascular diagnostics, ensuring timely and appropriate patient care, especially as of 2026.
List of Sources
- Define a Normal EKG: Key Features and Standards
- ECG/EKG Results Explained: Visual Guide (https://healthcentral.com/condition/heart-disease/ecg-ekg-results-explained-visual-guide)
- ECG Learning Center - An introduction to clinical electrocardiography (https://ecg.utah.edu/lesson/3)
- Normal Electrocardiography (ECG) Intervals: Normal Electrocardiography Intervals (https://emedicine.medscape.com/article/2172196-overview)
- Contextualize the Normal EKG: Importance in Cardiac Diagnostics
- Can an EKG detect heart failure? What it shows (https://medicalnewstoday.com/articles/can-an-ekg-detect-heart-failure)
- When to Get an Electrocardiogram: Key Signs & Symptoms | Cardiovascular Group (https://cvgcares.com/when-should-you-get-an-electrocardiogram-key-signs-to-watch-for)
- More Than 20 Percent of Low-Risk Patients Receive Annual ECG (https://dicardiology.com/content/more-20-percent-low-risk-patients-receive-annual-ecg)
- theneuralcloud.com (https://theneuralcloud.com/post/understanding-abnormal-electrocardiograms-causes-and-implications)
- Explore the Evolution of EKG Technology: Historical Insights
- A Brief History of the ECG Machine: From Inception to Now (https://getsmartheart.com/blogs/news/a-brief-history-of-the-ecg-machine-from-inception-to-now?srsltid=AfmBOoqcsWIciimUYz7GzPyHjLb9G5HhAvak8kn4dvncj4wr1Ei2UXqg)
- Exploring The Latest Breakthroughs & Advancements In ECG Tech | Executive Electrocardiogram Education (https://ecgedu.com/latest-advancements-in-ecg-tech)
- Forget Electrodes, the First EKG Machine Used Buckets of Saline Solution and Telephone Wire (https://spectrum.ieee.org/forget-electrodes-the-first-ekg-machine-used-buckets-of-saline-solution-and-telephone-wire)
- The Interesting History of EKGs (https://info.nhanow.com/blog/the-interesting-history-of-ekgs?hs_amp=true)
- Evolution of ECG Technology: From Analog to Digital - Norav Medical (https://noravmedical.com/evolution-of-ecg-technology-from-analog-to-digital)
- Identify Key Characteristics of a Normal EKG: Waveforms and Intervals
- ECG Learning Center - An introduction to clinical electrocardiography (https://ecg.utah.edu/lesson/3)
- CV Physiology | Electrocardiogram (EKG, ECG) (https://cvphysiology.com/arrhythmias/a009)
- ECG interpretation: Characteristics of the normal ECG (P-wave, QRS complex, ST segment, T-wave) – The Cardiovascular (https://ecgwaves.com/topic/ecg-normal-p-wave-qrs-complex-st-segment-t-wave-j-point)
- Normal Electrocardiography (ECG) Intervals: Normal Electrocardiography Intervals (https://emedicine.medscape.com/article/2172196-overview)
- ECG Patterns | Critical Diagnostic Skills for Doctors (https://tricog.com/common-ecg-patterns?srsltid=AfmBOoq8LOe7i-yvlaGIQwETMfQwhdgZ740zVpUapP5v53YG6_ND6rKX)