Introduction
Peaked T waves on an ECG can be a double-edged sword for clinicians, signaling both benign variations and serious cardiac conditions. These distinctive waveforms can indicate critical issues, particularly hyperkalemia, where elevated potassium levels pose significant health risks. Clinicians often struggle to differentiate between harmless T wave changes and those that indicate critical conditions. Understanding these nuances can be the difference between timely intervention and potential patient deterioration.
Define Peaked T Waves: Characteristics and Importance
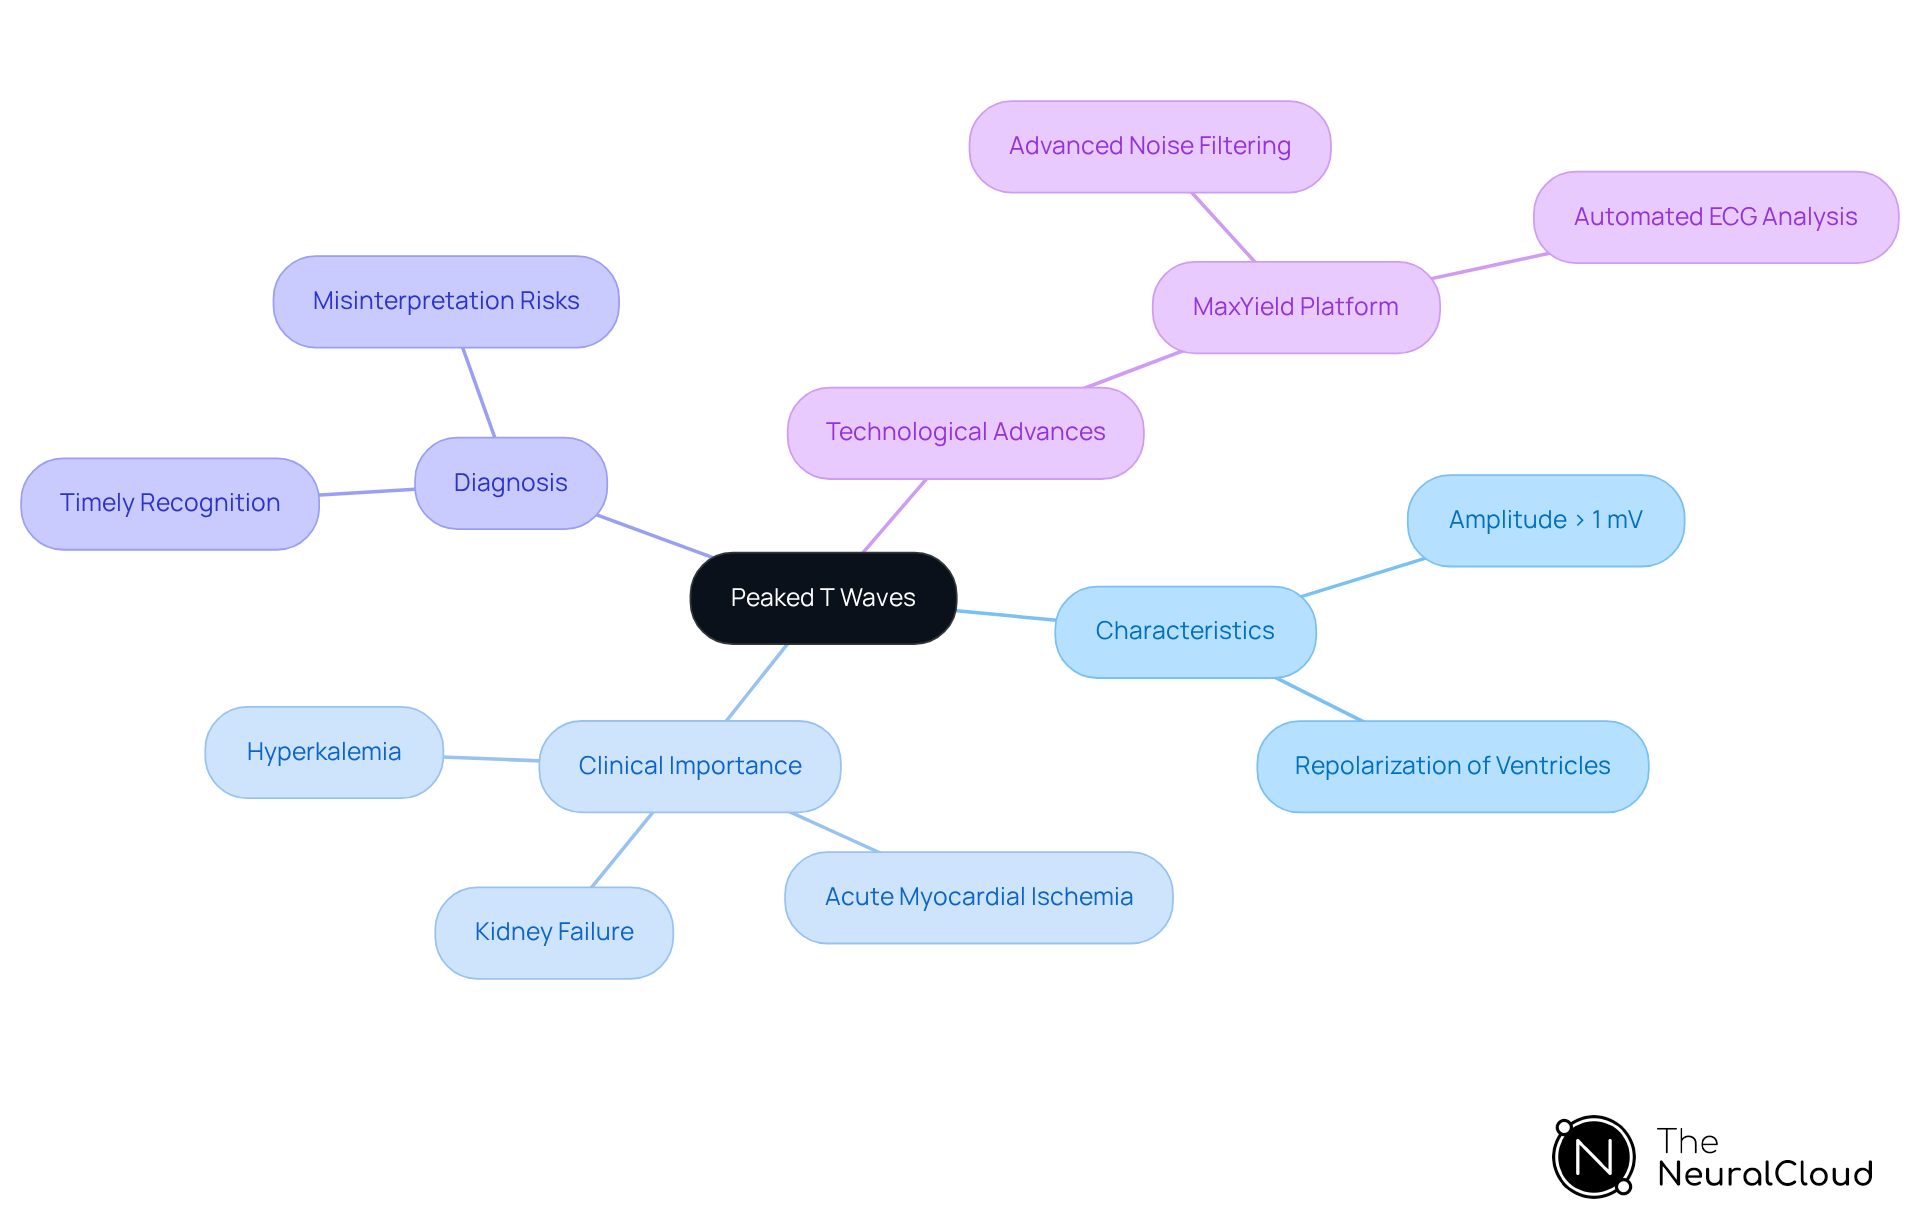
Understanding what does peaked T waves mean presents a significant challenge in ECG analysis due to their distinct characteristics and clinical implications. These oscillations show the repolarization of the ventricles and are considered elevated if their amplitude exceeds 1 mV. The clinical importance of elevated T patterns is profound, especially when considering what does peaked T waves mean, as they are closely linked to various cardiac conditions, particularly hyperkalemia, where increased potassium levels can trigger these distinctive ECG changes.
Recognizing elevated T patterns is crucial for timely diagnosis and intervention, especially in life-threatening scenarios such as acute myocardial ischemia or kidney failure. Studies indicate that elevated T patterns can appear within just 30 minutes after a total blockage of the coronary artery, acting as an early alert for significant cardiac incidents.
Moreover, case studies emphasize the significance of distinguishing between peaked T patterns and understanding what does peaked T waves mean in relation to elevated potassium levels versus ischemic conditions, as misinterpretation can lead to serious complications, including myocardial infarction. Misinterpretation of peaked T patterns can lead to serious complications.
The MaxYield platform from Neural Cloud Solutions offers advanced noise filtering and signal recognition to enhance the accuracy of identifying these abnormalities. MaxYield's automated ECG analysis not only delivers beat-by-beat insights but also adapts its algorithms to improve diagnostic yield over time. This improvement in diagnostic yield directly enhances patient management and outcomes, ensuring that clinicians are equipped with the most reliable data for effective management, ultimately safeguarding patient health.
Explore Clinical Significance: Implications of Peaked T Waves in Diagnosis
Understanding what does peaked T waves mean in ECG readings is critical, as they are indicators of serious health conditions, particularly hyperkalemia, which is characterized by elevated potassium levels in the bloodstream. This electrolyte imbalance can lead to severe complications, including life-threatening arrhythmias and cardiac arrest. For instance, a case study involving a 73-year-old man with a potassium level of 9.0 mmol/L demonstrated how prompt intervention normalized his ECG, underscoring the importance of recognizing elevated T patterns as warning signs.
Moreover, elevated T patterns can also signal early myocardial ischemia, especially in acute coronary syndromes. Severe potassium elevation can lead to significant ECG changes. These may include:
- Prominent T shapes
- A lack of visible P shapes
- Broadened QRS complexes
Such alterations complicate diagnosis and may be misinterpreted as idioventricular rhythms or ventricular tachycardia.
Research shows that when potassium levels rise above 8 mmol/L, patients consistently exhibit ECG irregularities, with prominent T deflections often being one of the earliest signs. The specificity of diagnosing severe hyperkalemia using a scoring system is notably high, highlighting the necessity for healthcare providers to act swiftly upon observing these changes on an ECG.
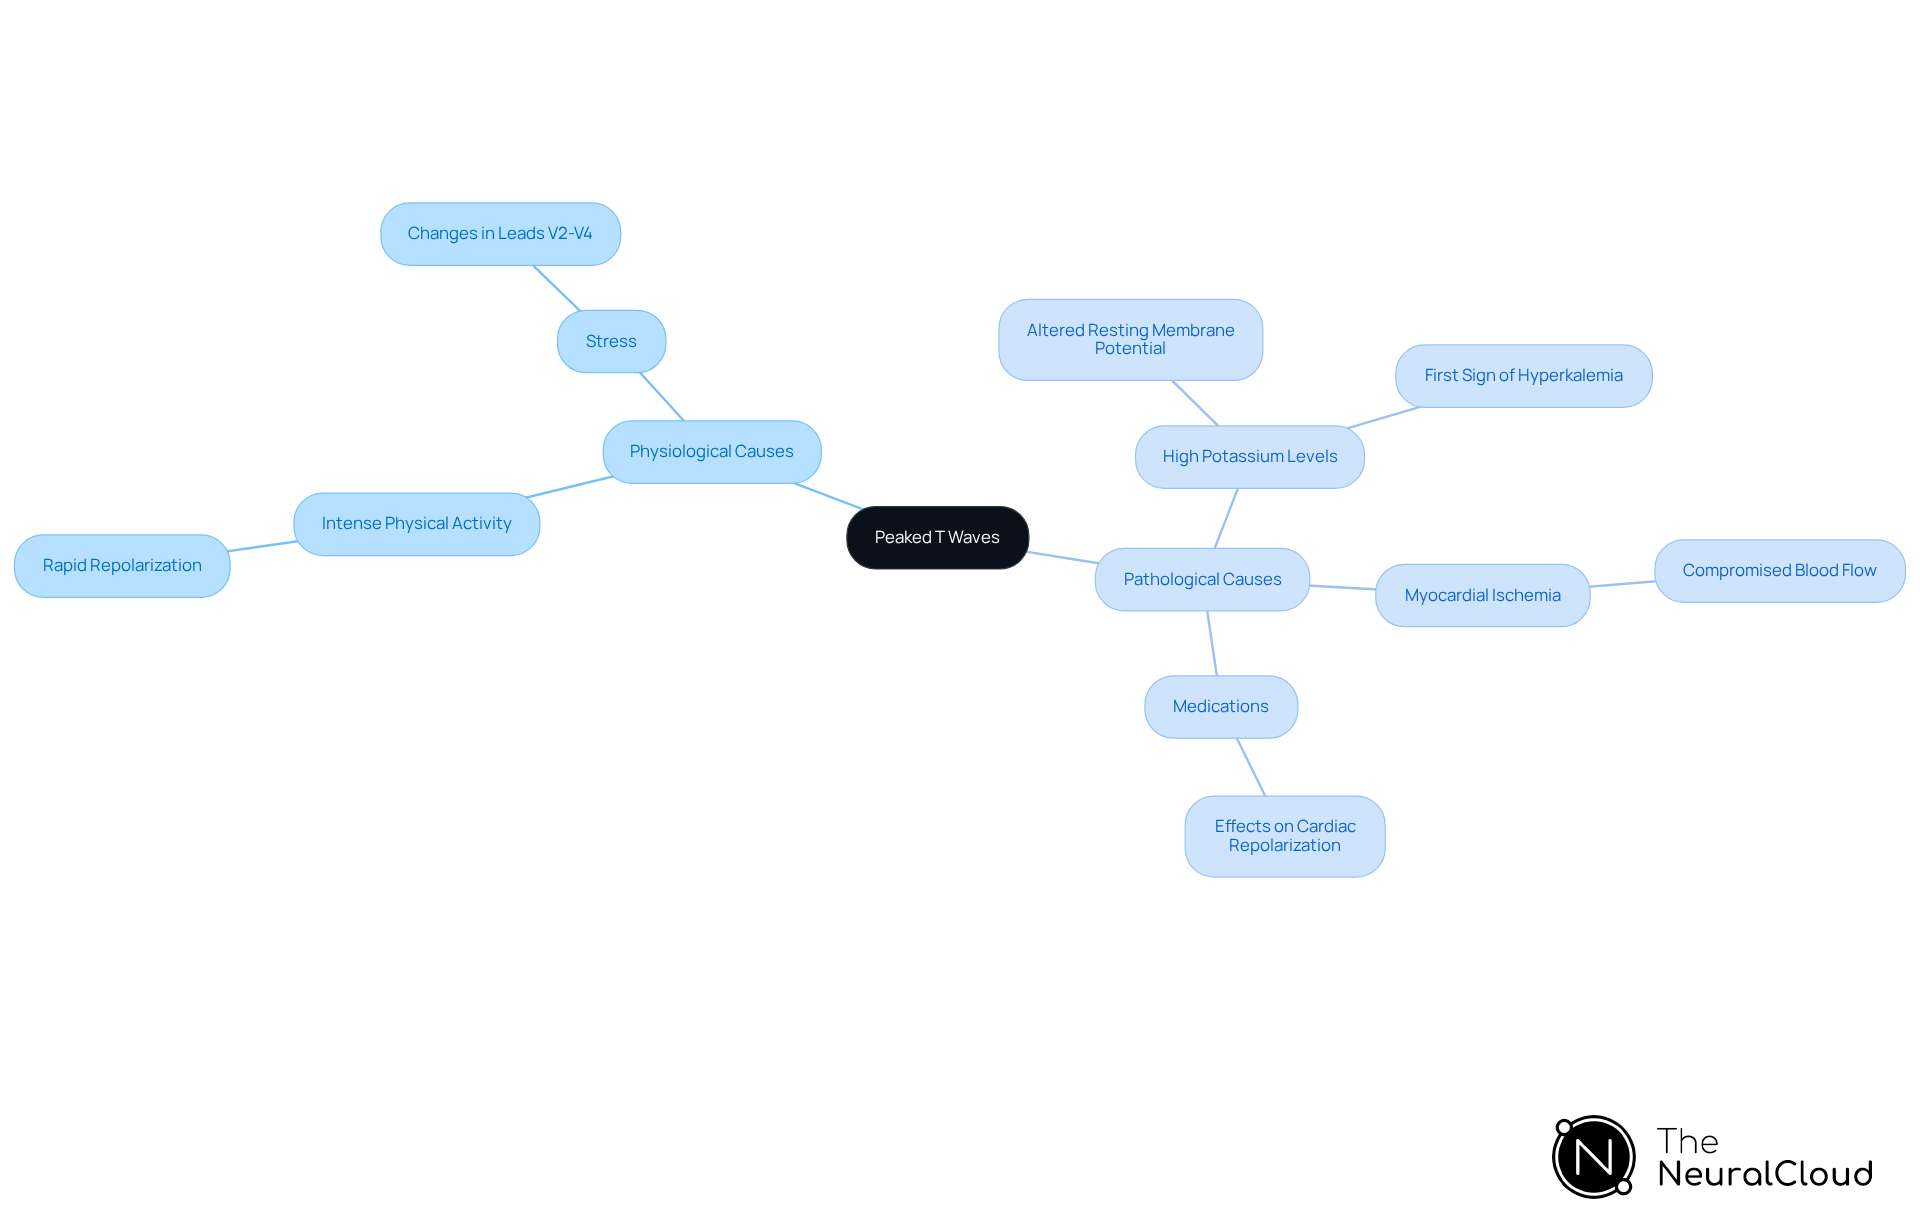
Experts emphasize that the presence of elevated T patterns should prompt immediate assessment and action, as they can be among the initial indicators of severe cardiac incidents. Understanding the clinical significance of elevated T patterns is essential for healthcare professionals, ensuring timely and effective patient care to prevent serious consequences.
'Neural Cloud Solutions' MaxYield™ platform addresses these challenges by utilizing advanced noise filtering and unique signal recognition capabilities. By swiftly isolating ECG signals from recordings affected by baseline wander, movement, and muscle artifact, MaxYield™ enhances the clarity of ECG data, which helps in understanding what does peaked T waves mean for more accurate interpretation. Additionally, the customizable visualization and reporting tool, Insight360, transforms MaxYield’s clean ECG data into interactive dashboards and clinical-ready reports, further supporting healthcare providers in their diagnostic efforts.
Investigate Causes: Physiological and Pathological Mechanisms Behind Peaked T Waves
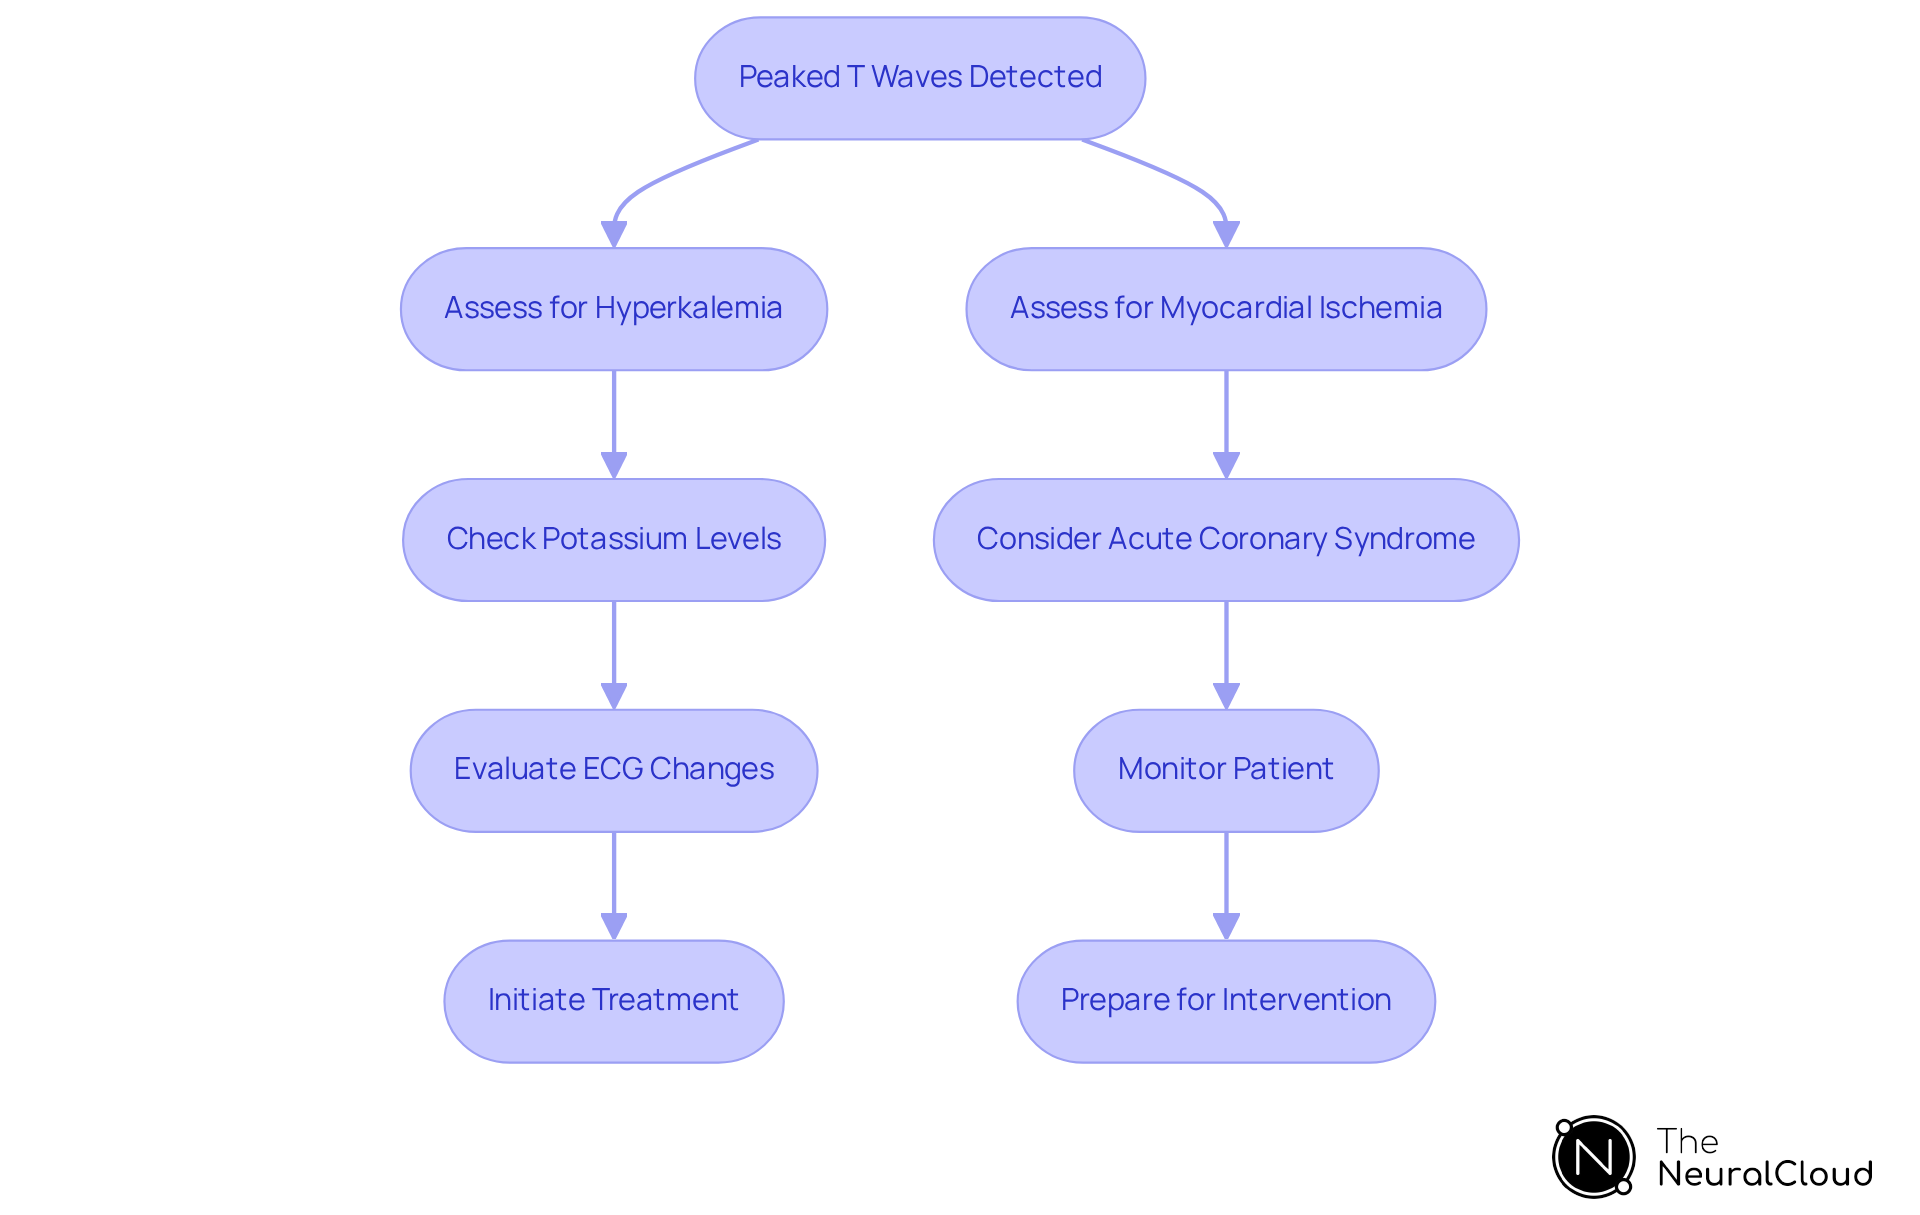
In ECG analysis, understanding what peaked T waves mean can signal critical physiological and pathological changes. They can arise from both healthy responses during intense physical activity or stress, where rapid repolarization occurs. This is particularly noticeable in leads V2-V4, where the shape of T waves can change significantly during stress.
Pathologically, elevated T waves are often associated with high potassium levels, which modify the resting membrane potential of cardiac cells, leading to quicker repolarization, raising the question of what peaked T waves mean. This change is crucial because understanding what peaked T waves mean is that they are the first sign of high potassium levels on an ECG, requiring swift clinical action to prevent life-threatening complications.
Other pathological causes include myocardial ischemia, where T changes can indicate compromised blood flow to the heart muscle, and certain medications that affect cardiac repolarization. Grasping these mechanisms is vital for accurate ECG interpretation and clinical decisions, especially in emergencies where quick diagnosis can greatly affect patient outcomes.
Integrating advanced technologies like MaxYield™ into clinical workflows enhances diagnostic accuracy and ensures prompt treatment. MaxYield™ automates the examination of ECG signals, providing beat-by-beat insights and efficiently isolating key characteristics. This emphasizes the significance of identifying elevated T waves in high potassium levels, particularly in understanding what peaked T waves mean for effective patient management. With its noise-resilient capabilities, MaxYield™ supports clinicians in making confident decisions based on clear, actionable data.
Analyze Diagnostic Challenges: Interpreting Peaked T Waves in Clinical Practice
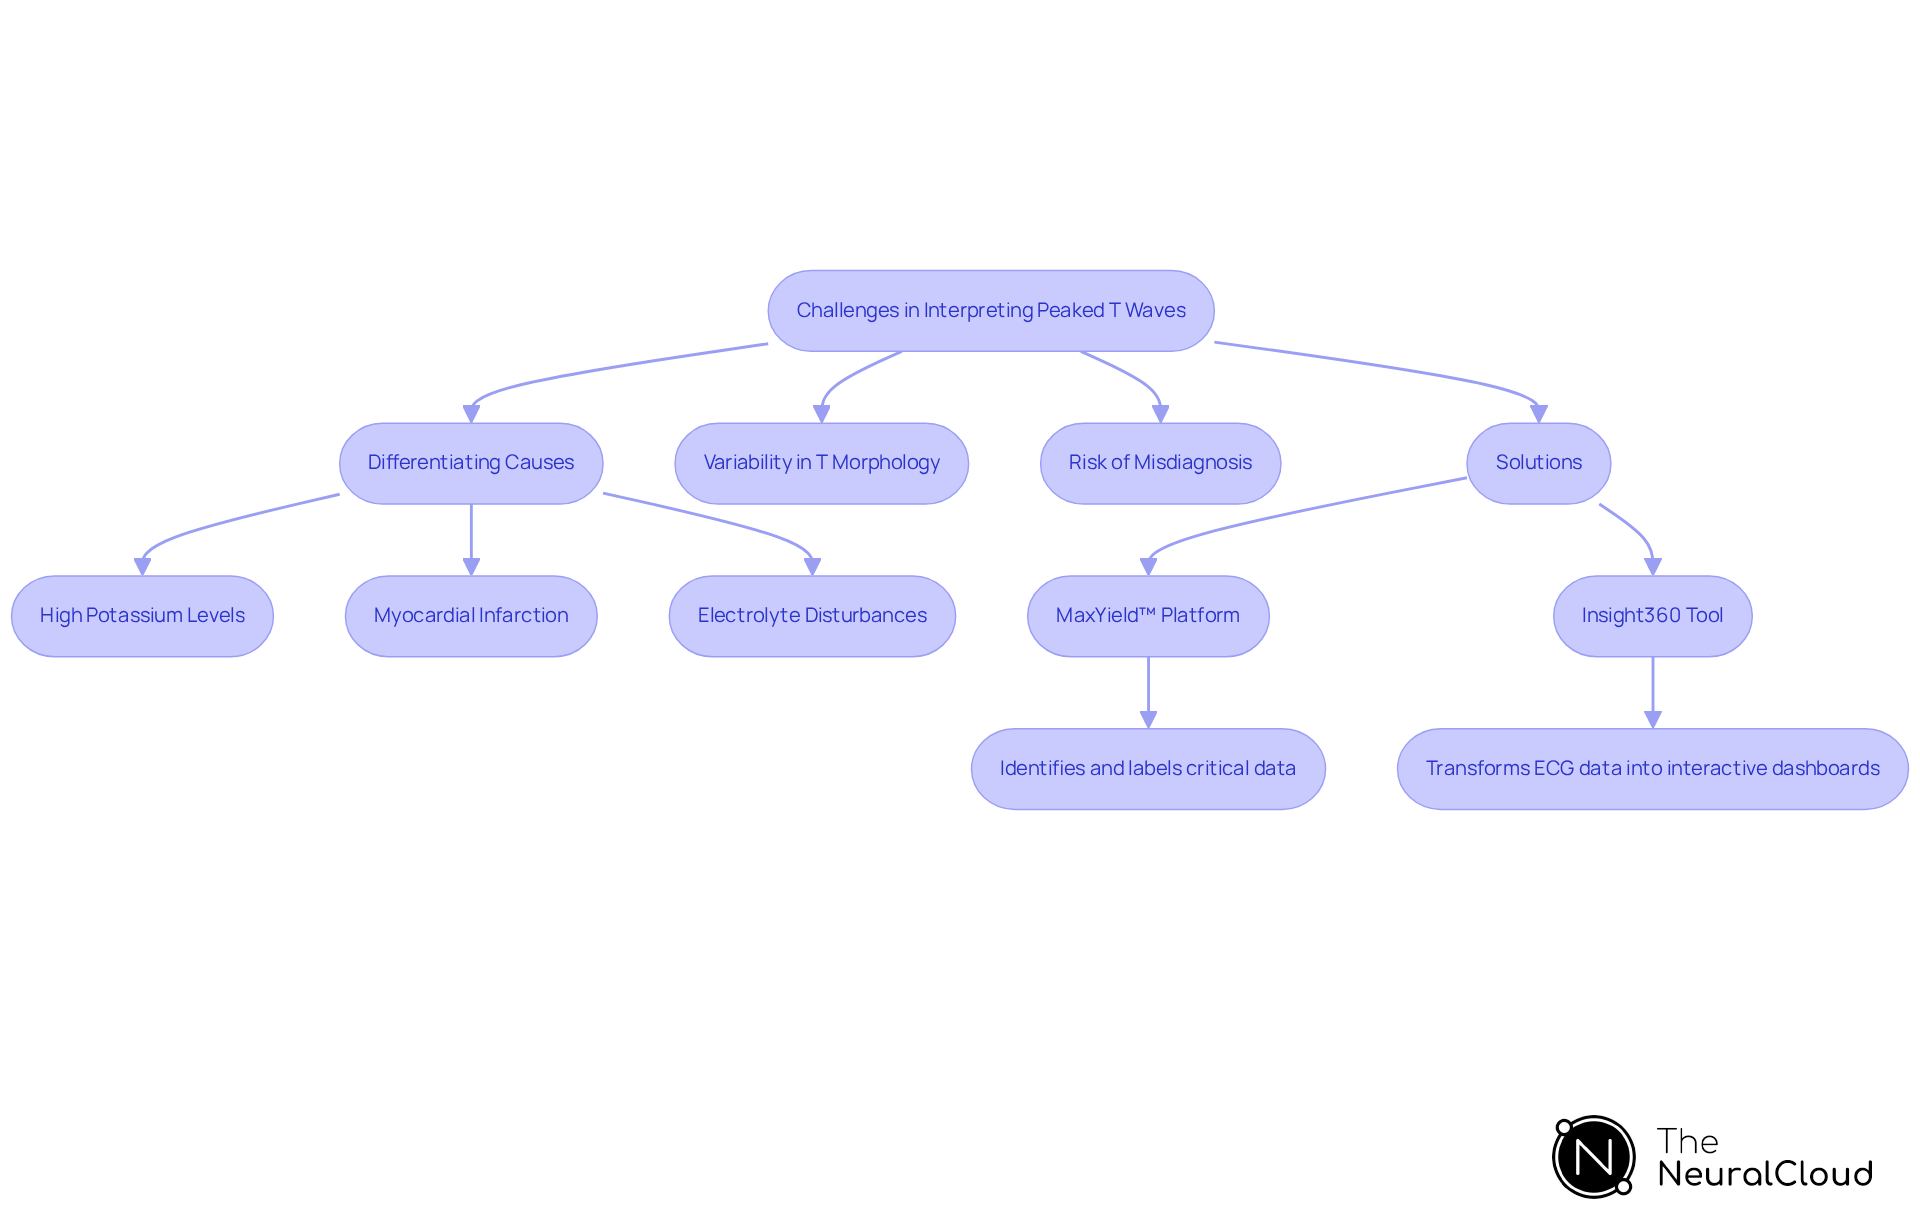
Clinicians often struggle with the complexities of interpreting elevated T patterns in ECG analysis. This challenge arises primarily from the need to differentiate between T patterns induced by high potassium levels and those resulting from conditions like early myocardial infarction or other electrolyte disturbances. The variability in T shape morphology across different patients further complicates interpretation. Clinicians must carefully consider the patient's clinical history, presenting symptoms, and accompanying ECG findings to avoid misdiagnosis. Misdiagnosis can result in delayed treatment and increased risk of complications. Statistics show that 66% of patients with mild potassium elevation experience ECG abnormalities, underscoring the importance of vigilant monitoring. A case study highlighted a patient with a serum potassium level of 9.3 mEq/L, demonstrating significant peaked T morphology alongside a widened QRS complex, prompting the question of what does peaked T waves mean and illustrating the critical need for accurate interpretation.
To address these challenges, leveraging Neural Cloud Solutions' MaxYield™ platform can significantly enhance the process. MaxYield™ identifies and labels critical data even in recordings with high levels of noise and artifact. By rapidly isolating ECG waves from recordings affected by baseline wander, movement, and muscle artifact, MaxYield™ helps clinicians salvage previously obscured sections of lengthy Holter, 1-Lead, and patch monitor recordings, ultimately improving diagnostic accuracy. Additionally, the Insight360 tool complements MaxYield™ by transforming clean ECG data into interactive dashboards and clinical-ready reports, further aiding in the interpretation process. It is important to note that MaxYield™ is currently pending FDA Class II SaMD clearance, ensuring compliance with regulatory standards.
Conclusion
Peaked T waves in ECG readings present unique challenges that are crucial for accurate cardiac assessment. These distinctive waveforms serve as critical indicators of underlying health issues, particularly hyperkalemia and myocardial ischemia. Recognizing their characteristics and implications can greatly enhance diagnostic accuracy and patient outcomes, emphasizing the need for healthcare professionals to be well-versed in interpreting these patterns.
This article explored key insights, including the physiological and pathological mechanisms behind peaked T waves, their clinical significance in diagnosing serious conditions, and the challenges clinicians face in interpretation. The role of advanced technologies, such as Neural Cloud Solutions' MaxYield™ platform, was highlighted as a vital tool in improving diagnostic clarity and efficiency, ultimately aiding in the management of patients at risk of severe cardiac events.
Given the complexities of peaked T waves, clinicians must stay vigilant and proactive in their ECG analysis. By leveraging advanced diagnostic tools and staying informed about the latest research, healthcare providers can ensure they are equipped to make informed decisions that safeguard patient health. Recognizing peaked T waves can be a critical factor in ensuring timely and effective patient care.
Frequently Asked Questions
What are peaked T waves in ECG analysis?
Peaked T waves are distinct oscillations in an ECG that represent the repolarization of the ventricles. They are considered elevated if their amplitude exceeds 1 mV.
Why are peaked T waves clinically important?
Peaked T waves are clinically important because they are closely linked to various cardiac conditions, particularly hyperkalemia, where increased potassium levels can trigger these distinctive ECG changes.
How quickly can elevated T patterns appear in critical situations?
Elevated T patterns can appear within just 30 minutes after a total blockage of the coronary artery, serving as an early alert for significant cardiac incidents such as acute myocardial ischemia.
What complications can arise from misinterpreting peaked T waves?
Misinterpretation of peaked T waves can lead to serious complications, including myocardial infarction, particularly when distinguishing between elevated potassium levels and ischemic conditions.
How does the MaxYield platform assist in identifying peaked T waves?
The MaxYield platform from Neural Cloud Solutions offers advanced noise filtering and signal recognition to enhance the accuracy of identifying peaked T waves and other ECG abnormalities.
What benefits does MaxYield provide for ECG analysis?
MaxYield's automated ECG analysis delivers beat-by-beat insights and adapts its algorithms to improve diagnostic yield over time, enhancing patient management and outcomes by providing reliable data for effective clinical decision-making.
List of Sources
- Define Peaked T Waves: Characteristics and Importance
- Understanding Peaked T Waves (https://clinician.com/blogs/clinicians/understanding-peaked-t-waves)
- EKG- Disorders of T Waves (https://cancertherapyadvisor.com/home/decision-support-in-medicine/hospital-medicine/ekg-disorders-of-t-waves)
- ECG T Wave - StatPearls - NCBI Bookshelf (https://ncbi.nlm.nih.gov/books/NBK538264)
- Impending Danger: Evolution of Hyperacute T Waves to Cardiac Arrest (https://cureus.com/articles/432103-impending-danger-evolution-of-hyperacute-t-waves-to-cardiac-arrest)
- theneuralcloud.com (https://theneuralcloud.com/post/master-peaked-t-waves-essential-ecg-analysis-techniques)
- Explore Clinical Significance: Implications of Peaked T Waves in Diagnosis
- Hyperkalemia ECG Changes: Peaked T Waves (https://powerfulmedical.com/blog/hyperkalemia-ecg-critical-changes)
- Hyperkalemia-Peaked T waves and ECG Recognition - Medcram Blog (https://blog.medcram.com/cme-courses/hyperkalemia-peaked-t-waves-and-ecg-recognition)
- ECG frequency changes in potassium disorders: a narrative review - PMC (https://pmc.ncbi.nlm.nih.gov/articles/PMC9301030)
- Impending Danger: Evolution of Hyperacute T Waves to Cardiac Arrest (https://cureus.com/articles/432103-impending-danger-evolution-of-hyperacute-t-waves-to-cardiac-arrest)
- Investigate Causes: Physiological and Pathological Mechanisms Behind Peaked T Waves
- EKG- Disorders of T Waves (https://cancertherapyadvisor.com/home/decision-support-in-medicine/hospital-medicine/ekg-disorders-of-t-waves)
- theneuralcloud.com (https://theneuralcloud.com/post/understanding-peaked-t-waves-in-hyperkalemia-mechanisms-and-management)
- Why T Waves Peak in Hyperkalemia (https://ecglectures.com/blog/peaked-t-waves-in-hyperkalemia)
- Hyperkalemia ECG Changes: Peaked T Waves (https://powerfulmedical.com/blog/hyperkalemia-ecg-critical-changes)
- Analyze Diagnostic Challenges: Interpreting Peaked T Waves in Clinical Practice
- Hyperkalemia ECG Changes: Peaked T Waves (https://powerfulmedical.com/blog/hyperkalemia-ecg-critical-changes)
- Understanding Peaked T Waves (https://clinician.com/blogs/clinicians/understanding-peaked-t-waves)
- EKG- Disorders of T Waves (https://cancertherapyadvisor.com/home/decision-support-in-medicine/hospital-medicine/ekg-disorders-of-t-waves)
- theneuralcloud.com (https://theneuralcloud.com/post/master-peaked-t-wave-criteria-for-accurate-ecg-interpretation)
- Why T Waves Peak in Hyperkalemia (https://ecglectures.com/blog/peaked-t-waves-in-hyperkalemia)