Introduction
Understanding the complexities of abnormal EKG strips is not merely a technical necessity; it plays a vital role in improving cardiac care. For developers of ECG analysis software, grasping the components and significance of these strips can lead to notable advancements in diagnostic accuracy and patient outcomes. However, interpreting these signals amidst noise and variability presents a significant challenge.
This is where innovative tools like the MaxYield™ platform come into play. The platform offers features designed to enhance ECG analysis, making it easier for healthcare professionals to interpret complex data accurately. By leveraging advanced algorithms and user-friendly interfaces, MaxYield™ simplifies the analysis process, allowing for quicker and more reliable diagnoses.
The advantages of using MaxYield™ are clear. Healthcare professionals can expect improved clinical decision-making, leading to better patient outcomes. With its ability to filter out noise and highlight critical information, the platform empowers users to focus on what truly matters in patient care. In summary, MaxYield™ transforms the challenges of ECG analysis into opportunities for enhanced cardiac care.
Clarify EKG Strip Fundamentals and Significance
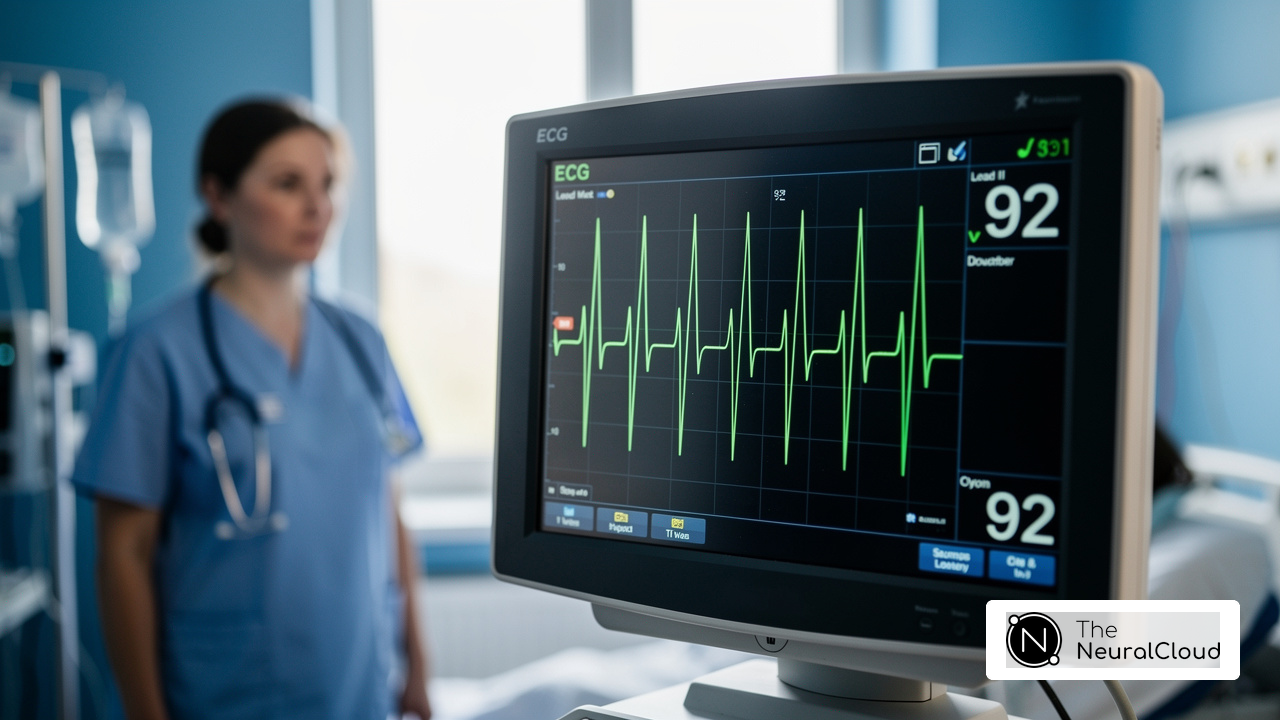
An electrocardiogram (EKG) strip can show an abnormal EKG strip that visually represents the heart's activity. For developers of medical software, understanding its components is essential. EKG strips consist of unique patterns, intervals, and segments that illustrate the heart's electrical impulses. The primary waves include:
- P Wave: Signifies atrial depolarization, indicating the electrical activity that triggers atrial contraction.
- QRS Complex: Represents ventricular depolarization, crucial for understanding how the heart's ventricles contract to pump blood.
- T Wave: Reflects ventricular repolarization, marking the recovery phase of the ventricles after contraction.
The significance of EKG strips, particularly in clinical settings, goes beyond their graphical representation; they provide real-time insights into cardiac health. This capability enables healthcare professionals to diagnose conditions such as arrhythmias and myocardial infarctions. Accurate interpretation of an abnormal EKG strip is vital, as a misdiagnosis can lead to severe consequences. For instance, delays in treatment for ST-elevation myocardial infarction (STEMI) can elevate mortality risk, underscoring the necessity for precise EKG evaluation.
For developers, grasping these components is crucial for designing algorithms that accurately interpret EKG signals. This understanding enhances diagnostic capabilities and improves patient care. The technology from Neural Cloud Solutions offers advanced tools and features, significantly enhancing the precision of EKG interpretations.
Features of MaxYield™:
- Adaptability with each use
Advantages for Healthcare Professionals:
- Simplifies the evaluation process
- Consistently reduces signal artifacts
- Leads to better patient outcomes
This innovative approach allows for faster and more efficient ECG analysis, ultimately resulting in improved patient outcomes.

Identify Key Components of EKG Strips
To effectively analyze EKG strips, developers must recognize several key components:
- P wave: This signal indicates atrial depolarization. Its morphology can suggest conditions such as atrial enlargement or other abnormalities.
- PR interval: This interval measures the time from the start of the P signal to the beginning of the QRS complex, reflecting conduction through the AV node. A normal PR interval ranges from 0.12 to 0.20 seconds.
- QRS complex: Representing ventricular depolarization, the width and morphology of the QRS complex can indicate various cardiac conditions, including bundle branch blocks. The QRS duration should not exceed 0.11 to 0.12 seconds.
- ST segment: The flat section between the end of the QRS complex and the start of the T wave is crucial for diagnosing ischemia. Abnormalities in this segment can indicate an abnormal EKG strip that may signal significant cardiac events.
- T wave: This phenomenon reflects ventricular repolarization. An abnormal EKG strip may indicate electrolyte imbalances or ischemia, which are essential for evaluating cardiac health.
- QT interval: Measuring the time from the start of the QRS complex to the end of the T wave, the QT interval is essential for evaluating the risk of arrhythmias. The average heart rate corrected tends to be longer in women than in men and increases with age.
Understanding these components allows developers to effectively recognize and categorize these features in EKG evaluation. The MaxYield™ platform from Neural Cloud Solutions offers advanced tools and analytics, enhancing clarity and efficiency in ECG analysis. This leads to improvements in healthcare settings, ultimately benefiting healthcare professionals by streamlining their workflow and enhancing patient care.

Apply Step-by-Step Methods for EKG Analysis
Analyzing an EKG strip can be challenging, but following systematic steps can streamline the process for developers. Here’s how the analysis works:
- Determine the Heart Rate: Count the number of R peaks in a 6-second strip and multiply by 10 for a quick estimate. This method is efficient and crucial for timely clinical decisions. MaxYield™ filters out noise, ensuring accurate identification of R signals, even in challenging recordings.
- Measure the Rhythm: Measure the intervals between R peaks to determine if the rhythm is regular or irregular. Consistent intervals suggest a regular rhythm, while variability may indicate arrhythmias, which are critical for diagnosis. MaxYield™ offers clear signal recognition, enabling more dependable rhythm analysis.
- Assess Atrial Activity: Check for the presence and shape of P waves to assess atrial activity. Abnormalities in P wave shape can indicate atrial enlargement or ectopic foci, essential for treatment decisions. MaxYield™’s advanced technology ensures that P waves are not obscured by artifacts, facilitating better evaluation.
- Measure the PR Interval: Ensure it falls within the normal range (0.12 to 0.20 seconds) to evaluate AV conduction. Deviations can indicate conduction delays or blocks, impacting patient management strategies. MaxYield™ supports this measurement by providing precise data even in noisy environments.
- Evaluate the QRS Complex: Measure its duration and morphology to identify any conduction abnormalities. Narrow QRS complexes typically suggest a junctional escape rhythm, while wide complexes may indicate ventricular issues. MaxYield™ improves clarity in QRS complex evaluation, allowing for accurate diagnosis.
- Examine the ST Segment: Look for elevation or depression, which can indicate ischemia or infarction. For instance, ST depression in leads V3-V5 is frequently linked to rate-related ischemia, emphasizing the significance of this evaluation in clinical practice. The platform’s capabilities ensure that subtle changes in the ST segment are reliably detected.
- Interpret the T Wave: Assess its shape and direction for signs of repolarization abnormalities. Alterations in T wave morphology can offer insights into electrolyte imbalances or ischemic conditions. MaxYield™’s sophisticated evaluation methods enhance diagnostic precision by ensuring that T wave changes are accurately recorded.
By implementing these steps, developers can create tools that guide users through the analysis process, enhancing diagnostic accuracy and ultimately improving patient outcomes. Utilizing Neural Cloud Solutions' MaxYield™ platform, which provides advanced analytics, can further enhance the efficiency and effectiveness of these tools, ensuring that critical data is accurately identified even in challenging recording conditions.

Recognize and Interpret Common EKG Abnormalities
Developers need to be familiar with common EKG abnormalities, as recognizing these is vital for effective diagnosis:
- Atrial fibrillation: This condition features irregularly irregular R-R intervals and the absence of P waves, indicating chaotic atrial activity. It’s the most common sustained arrhythmia, affecting millions worldwide, and can lead to serious complications if not managed quickly.
- Ventricular tachycardia: Characterized by a rapid heart rate and wide QRS complexes, it often requires immediate medical intervention. The urgency is highlighted by studies showing that delays in treatment can significantly increase mortality risk, with delays over 90 minutes leading to a threefold increase in the risk of death.
- Myocardial infarction: Identified by ST elevation, this abnormality signals ischemia or necrosis of heart tissue. Quick recognition and treatment of an infarction are crucial, as any delays can result in irreversible damage.
- Bundle branch block: This abnormality presents as a widened QRS complex, indicating delayed conduction through the ventricles. Understanding its implications is essential for assessing overall cardiac function and potential underlying conditions.
- Premature ventricular contractions: These early QRS complexes appear wide and bizarre, reflecting ectopic ventricular activity. While often benign, frequent PVCs can indicate underlying issues and require further investigation.
By programming their tools to accurately identify abnormalities, such as an infarction, developers can significantly enhance the accuracy of ECG evaluation software, ultimately improving patient outcomes. The 'Neural Cloud Solutions' MaxYield™ platform employs advanced AI technology and a Continuous Learning Model that evolves with each use, enhancing accuracy and efficiency in ECG evaluation. This transformation of lengthy and noisy ECG recordings into clean, crisp signals streamlines the triage process, ensuring timely interventions for conditions like STEMI, where every minute counts. Recent studies indicate that AI models can reduce false positives in EKG readings to about 8%, compared to nearly 42% with standard triage. Additionally, 28% of participants in relevant studies had at least one major ECG abnormality, underscoring the importance of accurate detection and analysis. Testimonials from healthcare professionals emphasize the effectiveness of the MaxYield™ platform in improving diagnostic precision and workflow efficiency.
Conclusion
Mastering the analysis of abnormal EKG strips is essential for developers in the ECG analysis software field. By understanding the fundamental components of EKG strips - like the P wave, QRS complex, and T wave - developers gain insights necessary for designing algorithms that enhance diagnostic accuracy. Accurate interpretation of these strips can lead to timely diagnoses, ultimately improving patient care and outcomes.
Key points emphasized throughout the article include:
- Recognizing the various components of an EKG strip
- Understanding common abnormalities such as atrial fibrillation and myocardial infarction
The MaxYield™ platform from Neural Cloud Solutions is an innovative tool that features advanced noise filtering and automated evaluation. These features significantly enhance the precision of EKG interpretations, providing developers with a robust solution for improving their software capabilities.
By following systematic methods for EKG analysis, developers can streamline the evaluation process, leading to better clinical decision-making. As the landscape of EKG analysis technology continues to evolve, the emphasis on accurate interpretation and efficient analysis becomes increasingly significant. Developers are encouraged to leverage tools like MaxYield™ to enhance their software's capabilities, ensuring healthcare professionals can deliver timely and effective care.
In conclusion, the future of cardiac health relies on the ability to recognize and interpret EKG abnormalities accurately. It is imperative for developers to stay informed and adapt to current trends in EKG analysis technology, ensuring they contribute to improved patient outcomes.
Frequently Asked Questions
What is an EKG strip?
An EKG strip is a visual representation of the heart's electrical activity over time, showing the electrical impulses that trigger heart contractions.
What are the main components of an EKG strip?
The main components of an EKG strip include the P Wave, QRS Complex, and T Wave. The P Wave signifies atrial depolarization, the QRS Complex represents ventricular depolarization, and the T Wave reflects ventricular repolarization.
Why are abnormal EKG strips significant?
Abnormal EKG strips provide real-time insights into cardiac health, enabling healthcare professionals to diagnose conditions such as arrhythmias and myocardial infarctions. Accurate interpretation is crucial for timely diagnosis and treatment.
What can happen if there is a delay in treating conditions like STEMI?
Delays in treatment for conditions like ST-elevation myocardial infarction (STEMI) can elevate mortality risk, highlighting the importance of precise EKG evaluation.
How does understanding EKG components benefit developers of ECG analysis software?
Understanding EKG components is essential for developers to design algorithms that accurately interpret EKG signals, enhancing diagnostic capabilities and improving patient care.
What features does the MaxYield™ platform offer?
The MaxYield™ platform offers advanced noise filtering, automated evaluation, and adaptability with each use, significantly enhancing the precision of EKG interpretations.
What advantages does MaxYield™ provide for healthcare professionals?
MaxYield™ simplifies the evaluation process, improves the ability to handle physiological variability and signal artifacts, enhances clinical decision-making, and leads to better patient outcomes.
List of Sources
- Clarify EKG Strip Fundamentals and Significance
- atriumhealth.org (https://atriumhealth.org/dailydose/2025/01/23/your-heart-health-starts-here-why-ekgs-are-a-vital-part-of-primary-care)
- New study finds AI model improves heart attack detection (https://health.ucdavis.edu/news/headlines/new-study-finds-ai-model-improves-heart-attack-detection/2025/11)
- ajconline.org (https://ajconline.org/article/S0002-9149(08)01715-3/fulltext)
- Accuracy of Physicians’ Electrocardiogram Interpretation (https://jamanetwork.com/journals/jamainternalmedicine/fullarticle/2771093)
- goodreads.com (https://goodreads.com/work/quotes/253683294)
- Identify Key Components of EKG Strips
- iworx.com (https://iworx.com/case-studies-ecg-decoding-and-analysis)
- myhealth.alberta.ca (https://myhealth.alberta.ca/Health/pages/conditions.aspx?hwid=zm2308)
- geekymedics.com (https://geekymedics.com/ecg-case-studies)
- pmc.ncbi.nlm.nih.gov (https://pmc.ncbi.nlm.nih.gov/articles/PMC3319226)
- en.wikipedia.org (https://en.wikipedia.org/wiki/Electrocardiography)
- Apply Step-by-Step Methods for EKG Analysis
- geekymedics.com (https://geekymedics.com/ecg-case-studies)
- Checking your browser - reCAPTCHA (https://pmc.ncbi.nlm.nih.gov/articles/PMC6592896)
- pmc.ncbi.nlm.nih.gov (https://pmc.ncbi.nlm.nih.gov/articles/PMC8890095)
- Accuracy of Physicians’ Electrocardiogram Interpretation (https://jamanetwork.com/journals/jamainternalmedicine/fullarticle/2771093)
- Recognize and Interpret Common EKG Abnormalities
- pmc.ncbi.nlm.nih.gov (https://pmc.ncbi.nlm.nih.gov/articles/PMC3319226)
- New study finds AI model improves heart attack detection (https://health.ucdavis.edu/news/headlines/new-study-finds-ai-model-improves-heart-attack-detection/2025/11)
- int.livhospital.com (https://int.livhospital.com/7-common-abnormal-rhythm-ecg-findings-quick-guide-to-irregular-heart-rhythms)
- Abnormal EKG: Results, causes, and next steps (https://medicalnewstoday.com/articles/324922)