Introduction
The normal ECG graph is a critical tool in cardiac health, offering essential insights into heart function and guiding clinical decision-making. For health tech developers, comprehending the intricate components and patterns of a normal ECG is essential, as it directly impacts the effectiveness of diagnostic tools. Despite technological advancements, misconceptions and limitations regarding ECG interpretations continue to exist, raising concerns about their reliability. This prompts the question: How can developers leverage innovative solutions to enhance the accuracy of ECG evaluations and ultimately improve patient outcomes?
Neural Cloud Solutions: MaxYield™ for Enhanced ECG Signal Clarity
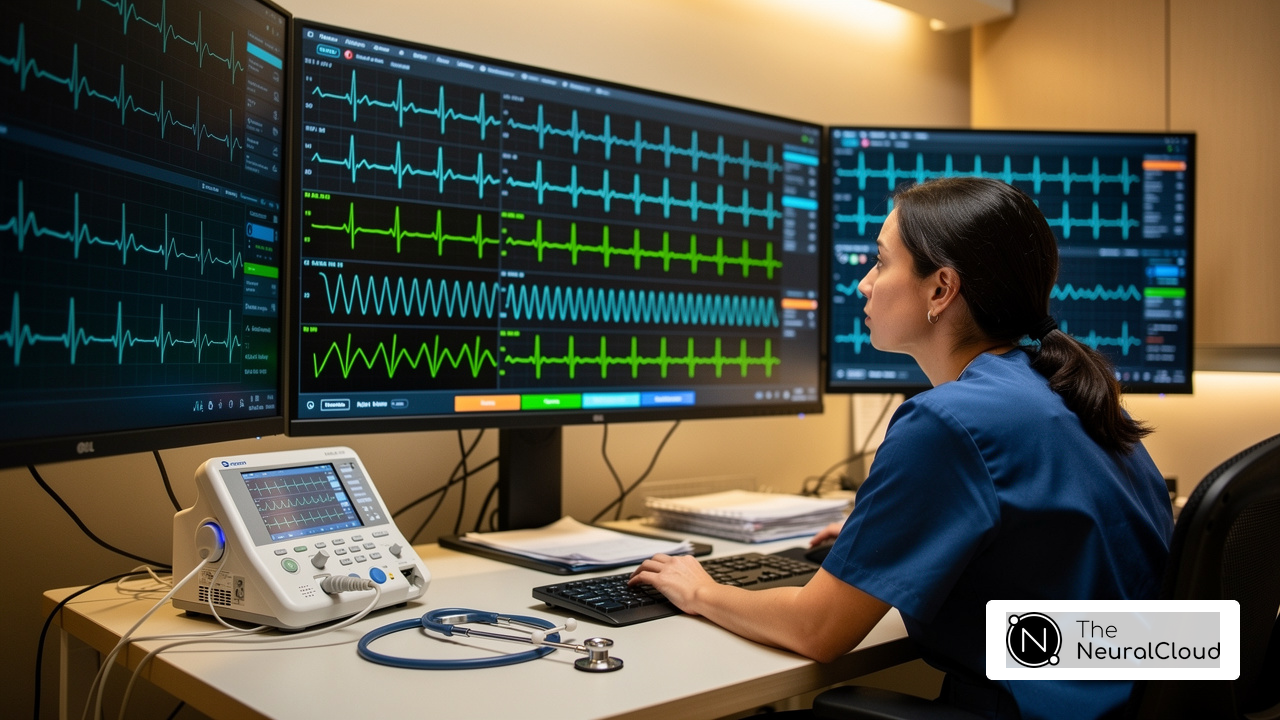
Neural Cloud Solutions is at the forefront of transforming healthcare through the automation of signal processing from various devices. This platform leverages advanced algorithms to significantly enhance the clarity of ECG signals, enabling healthcare providers to make informed decisions based on precise data. One of its standout features is the capability to process over 200,000 heartbeats in under five minutes, ensuring swift and reliable evaluations that are essential for timely diagnosis. As AI continues to reshape electrocardiography workflows, the clarity of ECG signals becomes vital for accurate assessments, ultimately improving patient outcomes.
MaxYield™ is designed to be device-agnostic, effortlessly capturing ECG recordings from any 1-lead or 3-lead device. This evolution in ECG signal processing provides an innovative solution that not only improves signal quality but also empowers clinicians with actionable insights. By reinforcing the critical role of technology in modern healthcare, the platform enhances the overall efficiency of ECG analysis. With its ability to provide clear and accurate data, MaxYield™ stands as a valuable asset in the pursuit of better patient care.
Understanding the Components of a Normal ECG: P-Wave, QRS Complex, and T-Wave
A standard ECG consists of three key components: the P-wave, QRS complex, and T-wave. The P-wave indicates atrial depolarization, the QRS complex signifies ventricular depolarization, and the T-wave reflects ventricular repolarization. Mastery of these elements is crucial for developers of ECG evaluation instruments, as they are vital for detecting irregularities in heart function.
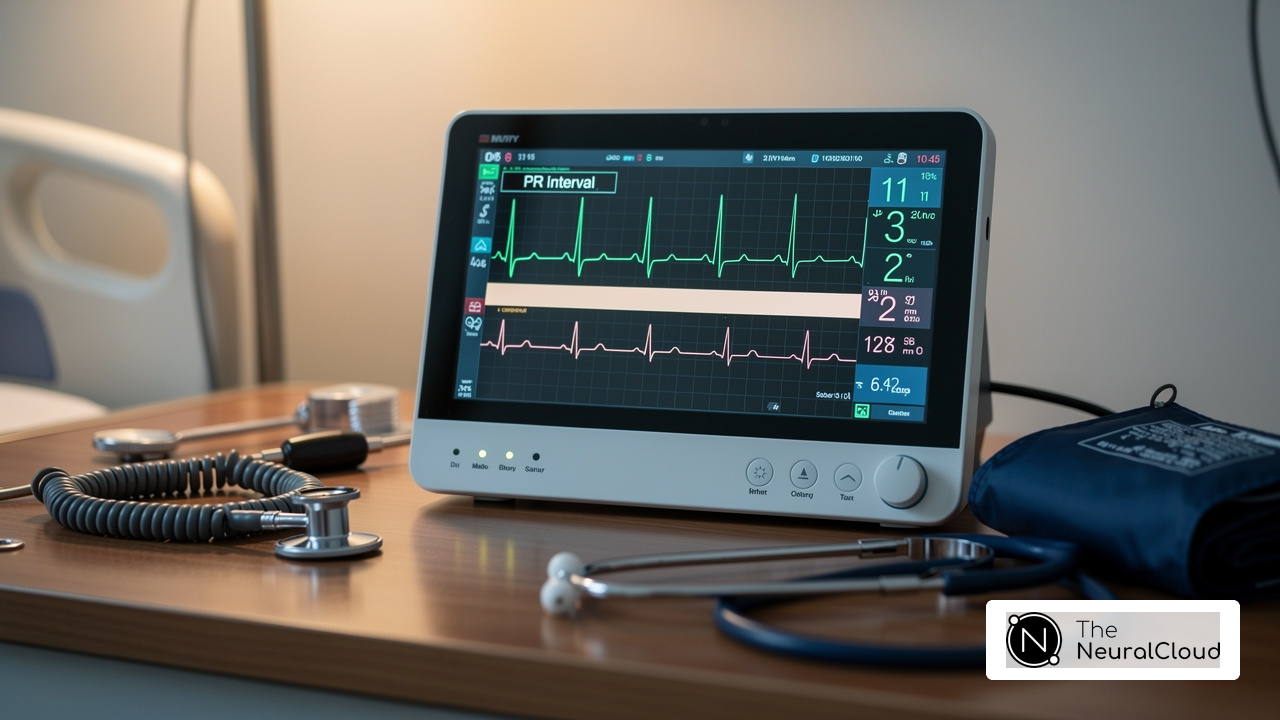
For example, the PR interval, which ranges from 0.12 to 0.20 seconds, is essential for assessing atrioventricular conduction. Abnormalities in this interval can signal underlying conduction issues, highlighting the necessity for accurate measurement in patients. Additionally, the QT interval should ideally be less than or equal to 0.40 seconds, which is important for evaluating the risk of arrhythmias, particularly in women, where it often tends to be longer.
Current research emphasizes the significance of T-wave morphology. Studies indicate that the T wave frequently displays asymmetrical shapes, characterized by a rapid descent to the isoelectric baseline, with variations observed between genders. Understanding these nuances is critical for developers aiming to create effective ECG analysis tools.
Leading cardiologists assert that a thorough understanding of the ECG and its components not only assists in identifying abnormalities but also improves overall cardiac health management. Given that heart disease remains the leading cause of death in the United States, the role of advanced technologies, such as those powered by MaxYield™, in early detection and intervention is paramount. The system tackles challenges in ECG interpretation by utilizing advanced algorithms and distinct wave recognition, facilitating the swift isolation of ECG waves even in recordings affected by significant noise and artifacts. Furthermore, the QT interval is crucial for evaluating ventricular conduction and identifying potential arrhythmias. By focusing on these essential elements and leveraging the capabilities of innovative tools, health tech developers can significantly enhance patient outcomes and advance cardiac care.

Recognizing Normal ECG Patterns: Key Indicators of Heart Health
can be illustrated by an ECG graph, which is characterized by consistent intervals and waveforms, crucial for assessing heart health. Key indicators of a regular rhythm include:
- A heart rate, typically ranging from 60 to 100 beats per minute.
- Well-defined intervals between waves—such as:
- PR interval (120-200 milliseconds)
- QRS duration (less than 120 milliseconds)
- QT interval (corrected QT should be less than 440 milliseconds for men and 460 milliseconds for women)
- The absence of abnormal spikes or dips that may indicate underlying issues.
Developers creating ECG analysis tools must prioritize these patterns to ensure accurate detection of heart conditions. Recent advancements in technology exemplify this, as they can analyze over one million ECGs, identifying patterns with a high degree of accuracy. This capability is essential for enhancing diagnostic precision and improving outcomes for individuals.
Current guidelines stress the importance of recognizing these indicators in the ECG, as they serve as benchmarks for identifying potential abnormalities. By focusing on these essential indicators, health tech developers can create effective ECG analysis tools that support clinicians in making informed decisions regarding patient care.

The Clinical Importance of Normal ECG Results in Cardiac Diagnosis
The clinical importance of normal ECG results in cardiac diagnosis is foundational in healthcare, as normal ECG results provide critical information. Clinicians rely on the accuracy of these results to effectively rule out conditions such as arrhythmias and ischemia, which can significantly impact patient outcomes. For health tech developers, the ability of their tools to accurately identify an abnormality is crucial for enhancing patient care.
Research indicates that including ECGs in pre-participation assessments can increase referrals to cardiology from 0.5% to 13%, underscoring the vital role of the ECG in detecting potential heart issues. Furthermore, the sensitivity of ECGs in identifying heart disease is markedly greater when used alongside other evaluations, with a noted sensitivity of only 44% for physical examinations alone. This emphasizes the importance of integrating ECG testing into clinical workflows.
Studies stress that the ECG is essential for ruling out heart conditions, enabling more targeted diagnostic efforts. The role of the ECG extends beyond initial evaluations; it aids in guiding treatment decisions and monitoring individual progress. As the landscape of heart care evolves, incorporating advanced ECG evaluation tools such as Neural Cloud Solutions' technology will be crucial for enhancing diagnostic accuracy and patient outcomes.
The system automates the identification of key features in every heartbeat, including P-wave, QRS complex, and T-wave onsets, processing up to 200,000 heartbeats in less than five minutes. By leveraging this technology, developers can improve diagnostic yield and enhance workflow efficiency, ultimately supporting clinicians in making informed decisions based on precise cardiac insights.

Debunking Myths: Common Misconceptions About Normal ECGs
Common misconceptions about the ECG include the belief that a normal result guarantees the absence of heart disease and that all heart conditions will manifest as abnormalities on an ECG. In reality, while an ECG is a valuable tool for assessing heart health, it is not infallible. Studies indicate that approximately 39% of ECGs are interpreted incorrectly, with significant implications for patient care. For instance, 16.1% of ischemia diagnoses were false positives, and 22.3% of ischemia cases went unrecognized. This highlights the critical need for improvements on automated ECG interpretations, especially given that traditional ECG interpretation technology can struggle with high levels of noise and artifacts, which can affect the accuracy of the results.
Neural Cloud Solutions' MaxYield™ addresses these challenges effectively. The platform utilizes advanced algorithms and distinct wave recognition, which improves ECG analysis accuracy and efficiency over time. By enhancing the reliability of ECG interpretations, MaxYield™ empowers healthcare providers to make more informed decisions regarding patient care.
Moreover, many individuals mistakenly believe that ECGs are only necessary for older adults or those exhibiting symptoms. In fact, ECG testing is essential for individuals of all ages, particularly those with risk factors such as hypertension or diabetes. Regular ECG testing can facilitate early detection of heart issues, even in asymptomatic patients, thereby improving overall health outcomes.
To combat these misconceptions, developers should focus on education in heart health. This includes debunking myths about the accuracy of normal results and emphasizing the importance of protocols that incorporate additional tests and clinical evaluations. By fostering a better understanding of ECG interpretation and leveraging technologies like MaxYield™, developers can create solutions based on accurate cardiac insights. Additionally, exploring innovations can enhance their ECG analysis capabilities.

Preparing for an ECG: Essential Steps for Accurate Results
To achieve an accurate ECG, individuals must adhere to several key steps. Avoiding caffeine and heavy meals prior to the test is crucial, as these can influence heart rhythm and overall comfort during the procedure. Patients should wear loose clothing to facilitate electrode placement and ensure good contact with the skin. Furthermore, it is essential for individuals to notify the technician regarding any medications they are using, as some may influence heart activity. However, even with proper preparation, challenges such as anxiety can impact the accuracy of readings displayed on the monitor.
This is where Neural Cloud Solutions' MaxYield™ comes into play. The platform utilizes advanced algorithms and distinct wave recognition to enhance the analysis of the ECG. By rapidly isolating ECG waves from recordings affected by baseline wander, movement, and muscle artifacts, MaxYield™ ensures that critical data is identified and labeled in the context of the heart rhythm, improving diagnostic yield. Furthermore, the system allows the algorithm to evolve with each use, continuously enhancing accuracy and efficiency.
For developers, incorporating these guidelines into their applications is essential. Alongside the integration of technologies like MaxYield™, this can enhance user compliance and improve the reliability of test outcomes. By highlighting these optimal methods and utilizing advanced technology, developers can aid in more efficient ECG testing, which can be reflected in an improved patient experience, ultimately benefiting healthcare outcomes.

The Role of Healthcare Professionals in ECG Interpretation
Healthcare professionals, particularly cardiologists and technicians, play a crucial role in ECG interpretation. Their expertise allows for efficient analysis of data, taking into account medical history and clinical context to make informed decisions.
To improve this process, developers should prioritize creating tools that assist healthcare professionals. This enables clinicians to interpret results with greater ease and accuracy.
Current trends indicate a growing emphasis on collaboration that support healthcare professionals, thereby enhancing communication between tech developers and clinicians. Such collaboration not only elevates the quality of ECG evaluations but also ensures that the process optimizes patient outcomes by facilitating timely and accurate diagnoses.

Understanding Limitations: When a Normal ECG May Not Be Enough
While the ECG generally serves as a reassuring indicator, it does not always encompass the complete spectrum of heart health. Conditions such as coronary artery disease and structural heart abnormalities may remain undetected through standard testing. For example, studies indicate that nearly 7.5% of participants with heart failure exhibited completely normal ECGs, highlighting the potential for misdiagnosis. Furthermore, the overall incidence of heart disease was significantly higher among individuals with abnormal results, suggesting that reliance solely on normal ECG results can be misleading.
Developers of ECG software should prioritize features that promote further testing when the ECG shows normal results. This holistic approach is essential, as many serious conditions may not be revealed through an ECG alone. For instance, arrhythmias resulting from myocardial infarctions can be detected on an ECG, but their absence does not exclude the possibility of underlying issues. Additional tests that complement ECG findings are often crucial for obtaining a comprehensive understanding of an individual's heart health.
Integrating these insights into ECG assessment tools can elevate diagnostic precision and ultimately enhance patient outcomes. Regular follow-ups and thorough assessments are vital for the healthcare system, particularly in populations at risk for cardiovascular diseases, which account for approximately 17.9 million deaths annually worldwide.
Lifestyle Factors Affecting ECG Results: What You Need to Know
Lifestyle factors such as diet, exercise, stress, and sleep significantly influence the results. High caffeine consumption, for instance, has been linked to arrhythmias, whereas regular physical activity is associated with improved heart health and lower blood pressure.
The American Heart Association recommends engaging in at least 150 minutes of moderate-intensity aerobic exercise weekly to enhance cardiovascular fitness. Additionally, dietary choices, particularly adherence to a heart-healthy diet, can substantially reduce the risk of cardiovascular diseases and contribute to an overall healthier lifestyle.
Research indicates that 29.1% of all diabetics experience cardiovascular complications, underscoring the importance of lifestyle factors in achieving an optimal health status. Given these insights, developers should prioritize the incorporation of lifestyle tracking features into their ECG assessment tools. This integration would empower users to obtain actionable insights, facilitating better health management and more informed decision-making.

Key Takeaways: Essential Insights About Normal ECGs
It is crucial for health tech developers to understand the components, patterns, and clinical significance of normal ECGs. Key components such as P-Wave, QRS Complex, and T-Wave provide insights into heart health. It is also essential to acknowledge the limitations and lifestyle factors that can affect outcomes when creating effective ECG analysis tools. Advanced technologies, like neural cloud solutions, exemplify how automation and AI can enhance ECG clarity and accuracy, ultimately contributing to improved patient outcomes.
MaxYield™ stands out by identifying and labeling critical data, even in recordings with high levels of noise and artifacts. Its ability to rapidly isolate ECG waves from recordings affected by baseline wander, movement, and muscle artifacts allows for the salvage of previously obscured sections of lengthy Holter, 1-Lead, and patch monitor recordings. This transforms ECG evaluation, converting noisy recordings into clear waveforms through cutting-edge AI technology.
Current trends indicate a growing dependence on AI solutions, particularly with solutions like MaxYield™ that demonstrate superior performance metrics compared to traditional methods. For instance, AI models have shown an area under the receiver operating characteristic (AUROC) of 85.2% in detecting arrhythmias, significantly reducing diagnostic delays and improving patient management. Furthermore, the ECG market is projected to grow at a compound annual growth rate (CAGR) of 10.1% from 2025 to 2032. As the healthcare landscape evolves, understanding these trends and leveraging innovative solutions like neural cloud technology will be vital for developers aiming to create impactful ECG analysis tools.

Conclusion
Understanding the normal ECG graph is crucial for health tech developers who aim to enhance cardiac care through advanced diagnostic tools. This article underscores the significance of accurately interpreting the components and patterns of the ECG, including the P-wave, QRS complex, and T-wave, which are vital for assessing heart health. By leveraging technologies such as Neural Cloud Solutions' MaxYield™ platform, the clarity and reliability of ECG evaluations can be significantly improved, ensuring that healthcare professionals have access to precise data for informed decision-making.
The key arguments presented include:
- The clinical importance of recognizing normal ECG patterns
- The need to address common misconceptions
- The influence of lifestyle factors on ECG results
While the normal ECG graph is a valuable diagnostic tool for heart conditions, it is not infallible. Therefore, developers must prioritize creating comprehensive ECG evaluation tools that integrate advanced technologies and facilitate thorough assessments to enhance patient outcomes.
As the health technology landscape continues to evolve, integrating AI-driven solutions like MaxYield™ will be essential. By fostering a deeper understanding of the normal ECG graph and its clinical implications, developers can significantly contribute to improved cardiac health management. Embracing these innovations not only enhances diagnostic accuracy but also empowers healthcare providers to deliver timely and effective care, ultimately leading to better patient outcomes in the fight against cardiovascular diseases.
Frequently Asked Questions
What is the MaxYield™ platform by Neural Cloud Solutions?
The MaxYield™ platform is an advanced solution for ECG evaluation that automates signal processing from various devices using AI algorithms to enhance the clarity of ECG signals, aiding healthcare professionals in making informed decisions.
How quickly can MaxYield™ process ECG data?
MaxYield™ can process over 200,000 heartbeats in under five minutes, allowing for swift and reliable evaluations that are essential for timely heart care.
Is MaxYield™ compatible with different ECG devices?
Yes, MaxYield™ is designed to be device-agnostic, meaning it can capture ECG recordings from any 1-lead or 3-lead device.
What are the key components of a normal ECG?
A standard ECG consists of three key components: the P-wave (indicating atrial depolarization), the QRS complex (signifying ventricular depolarization), and the T-wave (reflecting ventricular repolarization).
What is the significance of the PR interval in an ECG?
The PR interval, which ranges from 0.12 to 0.20 seconds, is crucial for assessing atrioventricular conduction, and abnormalities in this interval can indicate underlying conduction issues.
What does the QT interval indicate and what is its ideal duration?
The QT interval is important for evaluating the risk of arrhythmias, with an ideal duration of less than or equal to 0.40 seconds, particularly in women where it tends to be longer.
How does MaxYield™ improve ECG analysis?
MaxYield™ enhances ECG analysis by utilizing advanced noise filtering and distinct wave recognition, allowing for the swift isolation of ECG waves even in recordings affected by noise and artifacts.
What are the indicators of a normal ECG pattern?
Key indicators of a normal ECG pattern include a steady heart rate (60 to 100 beats per minute), well-defined intervals (PR interval of 120-200 milliseconds, QRS duration of less than 120 milliseconds, and corrected QT interval of less than 440 milliseconds for men and 460 milliseconds for women), and the absence of abnormal spikes or dips.
Why is understanding normal ECG patterns important for health tech developers?
Recognizing normal ECG patterns is essential for accurately detecting cardiac conditions and improving diagnostic precision, which ultimately enhances patient outcomes.
What role does advanced technology play in ECG evaluation?
Advanced technology, such as AI-driven ECG models, plays a critical role in analyzing large volumes of ECG data, improving the accuracy of normal rhythm identification, and supporting clinicians in making informed decisions regarding patient care.
List of Sources
- Neural Cloud Solutions: MaxYield™ for Enhanced ECG Signal Clarity
- newsnetwork.mayoclinic.org (https://newsnetwork.mayoclinic.org/discussion/new-study-suggests-ecg-ai-can-detect-cardiovascular-disease-risks-sooner)
- reuters.com (https://reuters.com/business/healthcare-pharmaceuticals/health-rounds-ai-expands-usefulness-common-heart-test-2025-07-18)
- news-medical.net (https://news-medical.net/news/20250721/AI-powered-ECG-model-outperforms-doctors-in-detecting-hidden-heart-disease.aspx)
- finance.yahoo.com (https://finance.yahoo.com/news/tempus-ai-gains-fda-nod-124400170.html)
- signifyresearch.net (https://signifyresearch.net/insights/philips-launches-ai-ecg-marketplace-global-first-integration-between-alivecor-and-ge-healthcare-powerful-medical-scores-e40-million-46m)
- Understanding the Components of a Normal ECG: P-Wave, QRS Complex, and T-Wave
- newsroom.heart.org (https://newsroom.heart.org/news/ecg-tests-may-someday-be-used-by-ai-model-to-detect-premature-aging-and-cognitive-decline)
- Normal Electrocardiography (ECG) Intervals: Normal Electrocardiography Intervals (https://emedicine.medscape.com/article/2172196-overview)
- news-medical.net (https://news-medical.net/news/20250721/AI-powered-ECG-model-outperforms-doctors-in-detecting-hidden-heart-disease.aspx)
- Characteristics of the Normal Electrocardiogram: Normal ECGWaves and Intervals (https://thoracickey.com/characteristics-of-the-normal-electrocardiogram-normal-ecgwaves-and-intervals)
- ECG Learning Center - An introduction to clinical electrocardiography (https://ecg.utah.edu/lesson/3)
- Recognizing Normal ECG Patterns: Key Indicators of Heart Health
- imperial.ac.uk (https://imperial.ac.uk/news/261516/ai-model-reads-ecgs-identify-female)
- imperial.nhs.uk (https://imperial.nhs.uk/about-us/news/ai-model-can-predict-health-risks)
- Normal Electrocardiography (ECG) Intervals: Normal Electrocardiography Intervals (https://emedicine.medscape.com/article/2172196-overview)
- The Clinical Importance of Normal ECG Results in Cardiac Diagnosis
- newsroom.heart.org (https://newsroom.heart.org/news/artificial-intelligence-enhanced-ecgs-may-speed-heart-failure-diagnosis-and-treatment)
- Normal Electrocardiography (ECG) Intervals: Normal Electrocardiography Intervals (https://emedicine.medscape.com/article/2172196-overview)
- journals.lww.com (https://journals.lww.com/nijc/fulltext/2023/20010/normal_values_of_electrocardiogram_among_healthy.2.aspx)
- gehealthcare.com (https://gehealthcare.com/insights/article/retrospective-analysis-of-ecg-data-supports-cardiologists'-clinical-judgment?srsltid=AfmBOoovZTp_hXlmeiQI5-CWX_1hgqsBQW6WsUKn1v8KITJlr2mClTex)
- bmccardiovascdisord.biomedcentral.com (https://bmccardiovascdisord.biomedcentral.com/articles/10.1186/s12872-017-0572-8)
- Debunking Myths: Common Misconceptions About Normal ECGs
- sunfox.in (https://sunfox.in/blogs/common-myths-about-ecg?srsltid=AfmBOoqhuZNvS15DJxPUfcBmxP31YKEDSyBr67Q8eazsxUlhoCYCkcgU)
- pubmed.ncbi.nlm.nih.gov (https://pubmed.ncbi.nlm.nih.gov/16321696)
- The most common errors in automatic ECG interpretation - PMC (https://pmc.ncbi.nlm.nih.gov/articles/PMC12137353)
- journalfeed.org (https://journalfeed.org/article-a-day/2024/computer-interpreted-normal-ecgs-can-wait)
- Preparing for an ECG: Essential Steps for Accurate Results
- ccdiagnostics.co.uk (https://ccdiagnostics.co.uk/how-to-prepare-for-your-ecg-appointment-for-accurate-results)
- pmc.ncbi.nlm.nih.gov (https://pmc.ncbi.nlm.nih.gov/articles/PMC5710571)
- What’s an EKG? (https://my.clevelandclinic.org/health/diagnostics/16953-electrocardiogram-ekg)
- sciencedirect.com (https://sciencedirect.com/science/article/pii/S0022073622000863)
- danleemedical.com (https://danleemedical.com/blog/everything-you-need-to-know-about-ekg-prep)
- The Role of Healthcare Professionals in ECG Interpretation
- jamanetwork.com (https://jamanetwork.com/journals/jamainternalmedicine/fullarticle/2771093)
- ahajournals.org (https://ahajournals.org/doi/10.1161/circ.148.suppl_1.13990)
- tricog.com (https://tricog.com/the-importance-of-ecg-interpretation-in-critical-care-settings?srsltid=AfmBOood8ReRbwXi47Qn5LxbIFjp51c0UruVvMu6NrNB32vMRI-8xmvn)
- kjr.com.au (https://kjr.com.au/case_studies/fatiguem8)
- ecg-od.com (https://ecg-od.com/case_studies/bradford-district-care-foundation-use-of-ecg-on-demands-ai-assisted-12-lead-ecg-interpretation-service)
- Understanding Limitations: When a Normal ECG May Not Be Enough
- Can an EKG detect heart failure? What it shows (https://medicalnewstoday.com/articles/can-an-ekg-detect-heart-failure)
- coursehero.com (https://coursehero.com/file/32107779/Case-study-2docx)
- tandfonline.com (https://tandfonline.com/doi/full/10.1080/07853890.2016.1202442)
- artemiscardiac.com (https://artemiscardiac.com/blog/heart-attack-ecg-vs-normal-ecg-how-to-check-ecg-report)
- Lifestyle Factors Affecting ECG Results: What You Need to Know
- pmc.ncbi.nlm.nih.gov (https://pmc.ncbi.nlm.nih.gov/articles/PMC10165078)
- pmc.ncbi.nlm.nih.gov (https://pmc.ncbi.nlm.nih.gov/articles/PMC10460604)
- nature.com (https://nature.com/articles/s41598-024-62142-8)
- newsnetwork.mayoclinic.org (https://newsnetwork.mayoclinic.org/discussion/lifestyle-links-to-heart-health-go-beyond-food-exercise-mayo-clinic-healthcare-expert-explains)
- Key Takeaways: Essential Insights About Normal ECGs
- 10 Insights from Healthcare Innovators: The Best Quotes from the ‘Leader to Leader’ Podcast in 2024 - Healthcare IT Leaders (https://healthcareitleaders.com/blog/insights-from-healthcare-innovators)
- Mobile ECG Devices Market Size, Share | Forecast [2026-2034] (https://fortunebusinessinsights.com/mobile-ecg-devices-market-109626)
- news-medical.net (https://news-medical.net/news/20250721/AI-powered-ECG-model-outperforms-doctors-in-detecting-hidden-heart-disease.aspx)
- jamanetwork.com (https://jamanetwork.com/journals/jamainternalmedicine/fullarticle/2820721)
- deliberatedirections.com (https://deliberatedirections.com/quotes-future-of-healthcare)