Introduction
Many clinicians find it challenging to interpret T wave morphology accurately, which is crucial for effective cardiac care. Recognizing peaked T waves is crucial because these abnormalities may indicate serious conditions like hyperkalemia or myocardial ischemia.
How can healthcare professionals enhance their diagnostic skills to ensure timely and accurate patient management when faced with these critical ECG changes?
Let’s explore the details of peaked T wave criteria and discuss practical steps clinicians can take to improve their ECG interpretation skills.
Define Normal T Wave Characteristics
Accurate ECG analysis is essential for effective cardiac care, yet many clinicians face challenges in interpreting T wave characteristics. Normal T forms display a smooth, rounded shape and are mainly upright in most positions, with exceptions in aVR and occasionally V1. The amplitude of T signals is generally below 5 mm in limb electrodes and under 10 mm in precordial electrodes. In adults, T waves are positive in positions I, II, and V3-V6, with the highest amplitudes typically observed in V2 and V3. Grasping these characteristics helps clinicians spot potential abnormalities more effectively, as deviations from these norms can signal underlying cardiac conditions.
Key Characteristics:
- Upright in Leads: Positive in most leads except aVR and V1.
- Amplitude: Less than 5 mm in limb leads and less than 10 mm in precordial leads.
- Shape: Smooth and rounded, with a steeper downslope compared to the upslope.
Recognizing these characteristics allows clinicians to establish a solid baseline for ECG analysis, which aids in the detection of pathological alterations such as the peaked T wave criteria. Accurate interpretation of T wave characteristics is vital; it helps prevent misdiagnosis and directs appropriate clinical actions.

Identify Criteria for Peaked T Waves
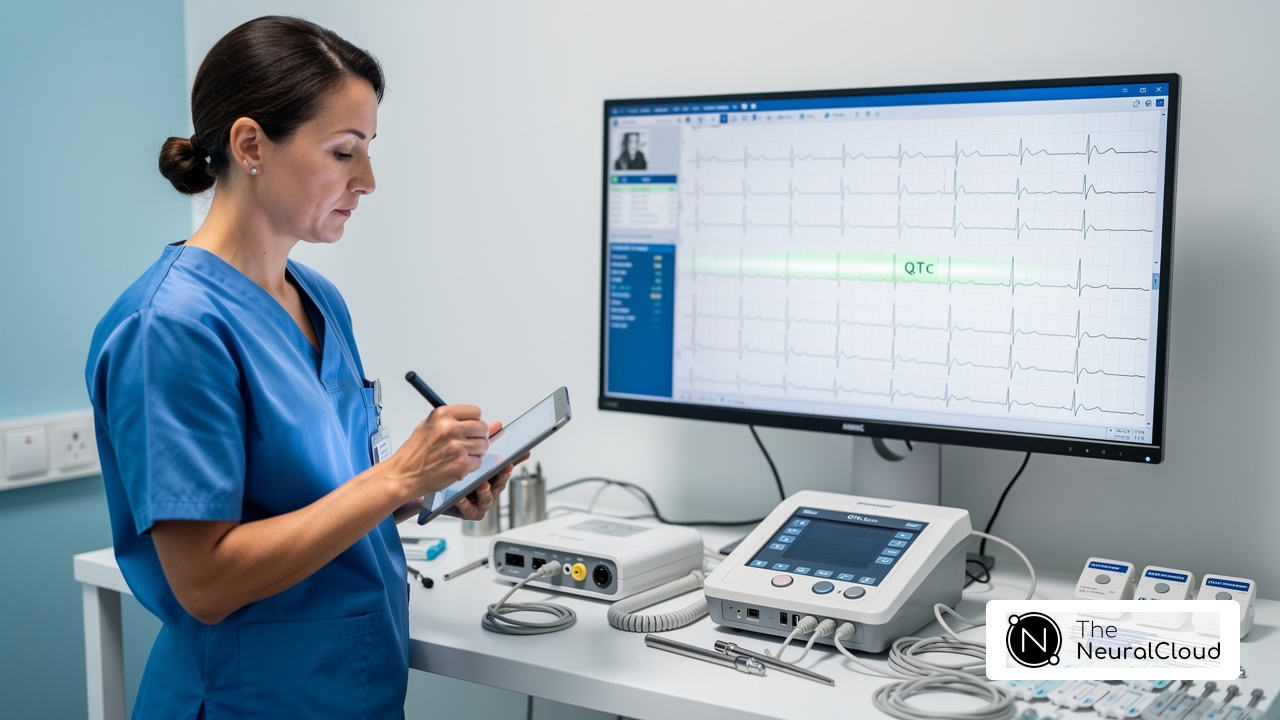
Accurate ECG interpretation is often hindered by noise and artifacts, complicating patient management decisions. Peaked T forms are characterized by their tall, narrow, and symmetric appearance, often resembling a 'tent shape.' The criteria for identifying peaked T waves include:
- Amplitude: Typically exceeds 5 mm in limb leads and 10 mm in precordial leads, indicating significant elevation.
- Symmetry: The peak is sharp and symmetrical, which aids in distinguishing it from other T abnormalities.
- Location: Most pronounced in leads V2 and V3, though they may appear in other leads depending on the underlying condition.
Peaked T waves are frequently associated with hyperkalemia, myocardial ischemia, and other cardiac abnormalities. For example, a case study involving a patient with a serum potassium level of 9.3 mEq/L displayed significant peaked T morphology along with a widened QRS complex, highlighting the importance of identifying these criteria for prompt intervention. Statistics indicate that 66% of patients with mild potassium elevation (6.5-7 mmol/L) show ECG abnormalities, emphasizing the critical need for vigilant monitoring of potassium levels in clinical practice.
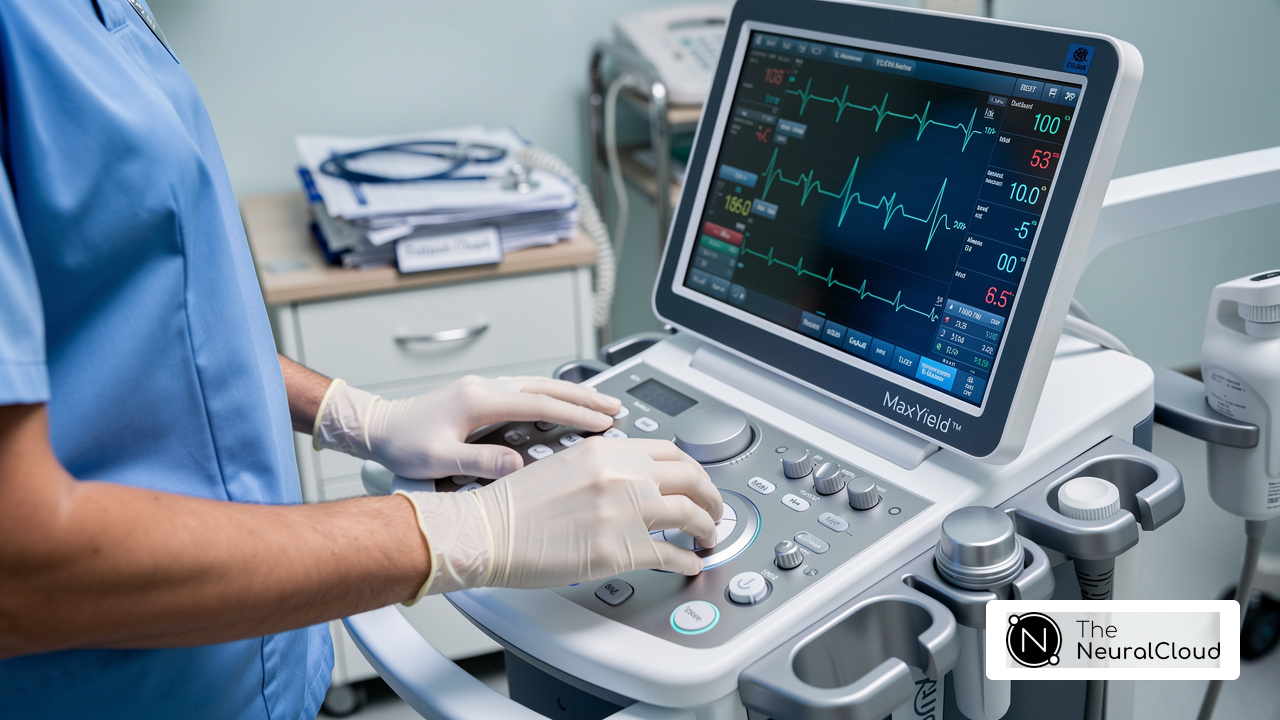
MaxYield™ from Neural Cloud Solutions Inc. streamlines ECG analysis by automatically identifying and labeling critical data, even in noisy recordings. This advanced AI-driven ECG analysis tool quickly separates ECG signals from recordings influenced by baseline wander, movement, and muscle artifact, ensuring that healthcare professionals can make informed decisions regarding patient management. Furthermore, MaxYield™ is currently pending FDA Class II SaMD clearance, ensuring compliance with regulatory standards. As Dr. Alan Rabinowitz notes, "MaxYield™ rivals human interpretation in precision, significantly reducing noise and enhancing diagnostic yield." Recognizing the peaked T wave criteria is crucial for healthcare professionals, especially in emergency settings where accurate ECG interpretation can significantly impact outcomes. By leveraging advanced technology like MaxYield™, healthcare professionals can enhance their diagnostic capabilities and improve patient care outcomes.

Explore Clinical Implications of Peaked T Waves
Accurate identification of the peaked T wave criteria is crucial for effective patient management in various clinical scenarios. The following outlines the key implications associated with peaked T waves:
Clinical Conditions Associated with Peaked T Waves:
- Hyperkalemia: Elevated potassium levels are known to cause tall, peaked T waves. If left unaddressed, this condition can lead to severe arrhythmias, emphasizing the need for prompt recognition and intervention.
- Myocardial Ischemia: The peaked T wave criteria can indicate an early warning sign of ischemia, especially in acute coronary syndromes, where timely diagnosis is crucial for patient outcomes.
- Acute Myocardial Infarction (AMI): In the early phases of AMI, the peaked T wave criteria may appear prior to other notable alterations, such as ST elevation, rendering their identification crucial for prompt intervention.
Importance of Recognition:
Recognizing peaked T waves promptly can lead to necessary diagnostic tests and interventions, significantly reducing the risk of serious complications such as cardiac arrest. Clinicians must maintain a high level of vigilance in monitoring ECG changes, particularly in patients with established risk factors for cardiac disease. Statistics indicate that in cases of severe hyperkalemia, all patients exhibit ECG abnormalities, underscoring the critical nature of these findings in clinical practice. Furthermore, expert opinions highlight that accurate recognition of T-wave abnormalities is essential for guiding diagnostic testing and initiating appropriate therapies, reinforcing the need for advanced ECG analysis tools in modern healthcare settings.

Apply Knowledge in ECG Interpretation
Understanding T wave characteristics is crucial for accurate ECG interpretation and patient management. To effectively apply knowledge of T wave characteristics and the implications of peaked T waves in ECG interpretation, follow these steps:
Steps for ECG Interpretation:
- Review the ECG: Start by analyzing the complete ECG strip, concentrating on the T shape characteristics in all channels.
- Evaluate T Wave Features: Ascertain if the T shapes are typical or elevated based on the peaked T wave criteria. Look for amplitude, symmetry, and position of the electrode.
- Consider Clinical Context: Evaluate the patient's clinical history and symptoms. Are there signs of hyperkalemia or ischemia? Significantly, elevated T shapes that fulfill the peaked T wave criteria are frequently linked to increased potassium levels, which can lead to severe complications if not managed quickly.
- Document Findings: Make sure to document any abnormalities in the ECG report, especially noting the presence of peaked T wave criteria and what they might mean for the patient. Accurate documentation is crucial for effective communication and follow-up.
- Communicate with the Healthcare Team: Share findings with the clinical team to ensure appropriate follow-up and management. Coordination among healthcare professionals is essential for optimizing patient outcomes, especially in cases involving T-wave abnormalities.
By systematically applying this knowledge, healthcare professionals can enhance their ECG interpretation skills, leading to improved patient care and outcomes. By leveraging tools like MaxYield™, healthcare professionals can significantly enhance their ECG analysis capabilities, ultimately improving patient care.

Conclusion
Accurate interpretation of peaked T waves is vital for effective cardiac care, influencing both clinical decisions and patient outcomes. By mastering the criteria for identifying these T wave abnormalities, healthcare professionals can significantly enhance their diagnostic capabilities, ensuring timely interventions that can prevent serious complications.
The article outlined the key characteristics of normal T waves, the specific criteria for recognizing peaked T waves, and the clinical implications associated with these findings. It emphasized the importance of understanding T wave morphology, particularly in the context of conditions such as hyperkalemia and myocardial ischemia. The integration of advanced tools like MaxYield™ from Neural Cloud Solutions Inc. further supports clinicians in achieving precise ECG analysis, even in challenging scenarios.
Ultimately, accurately identifying and interpreting peaked T waves is essential for ensuring patient safety and effective care. Clinicians should actively apply the insights from this tutorial in their daily practice, ensuring that they remain vigilant in monitoring ECG changes. By doing so, they can enhance patient safety and improve cardiac care practices.
Frequently Asked Questions
What are the normal characteristics of T waves in an ECG?
Normal T waves display a smooth, rounded shape and are mainly upright in most positions, except in aVR and occasionally V1.
What is the typical amplitude of T waves in limb and precordial electrodes?
The amplitude of T waves is generally below 5 mm in limb electrodes and under 10 mm in precordial electrodes.
In which leads are T waves typically positive in adults?
T waves are positive in leads I, II, and V3-V6, with the highest amplitudes usually observed in V2 and V3.
Why is it important for clinicians to understand normal T wave characteristics?
Understanding normal T wave characteristics helps clinicians spot potential abnormalities, as deviations from these norms can indicate underlying cardiac conditions.
What shape do normal T waves have?
Normal T waves have a smooth and rounded shape, with a steeper downslope compared to the upslope.
How does recognizing T wave characteristics aid in ECG analysis?
Recognizing T wave characteristics allows clinicians to establish a solid baseline for ECG analysis, which aids in detecting pathological alterations and prevents misdiagnosis.
List of Sources
- Define Normal T Wave Characteristics
- eurekalert.org (https://eurekalert.org/news-releases/730912)
- ECG T Wave - StatPearls - NCBI Bookshelf (https://ncbi.nlm.nih.gov/books/NBK538264)
- T wave (https://litfl.com/t-wave-ecg-library)
- New guidelines promote improved diagnosis and treatment for rare form of heart attack disproportionately affecting women (https://ottawaheart.ca/news/new-guidelines-promote-improved-diagnosis-and-treatment-rare-form-heart-attack-disproportionately-affecting-women)
- onlinecjc.ca (https://onlinecjc.ca/article/S0828-282X(23)00520-2/fulltext)
- Identify Criteria for Peaked T Waves
- theneuralcloud.com (https://theneuralcloud.com/post/understanding-peaked-t-waves-in-hyperkalemia-mechanisms-and-management)
- ECG T Wave - StatPearls - NCBI Bookshelf (https://ncbi.nlm.nih.gov/books/NBK538264)
- Understanding Peaked T Waves (https://clinician.com/blogs/clinicians/understanding-peaked-t-waves)
- Hyperacute T waves and Occlusion MI | ECG Cases| Emergency Medicine Cases (https://emergencymedicinecases.com/hyperacute-t-waves-occlusion-mi)
- Explore Clinical Implications of Peaked T Waves
- theneuralcloud.com (https://theneuralcloud.com/post/understanding-peaked-t-waves-in-hyperkalemia-mechanisms-and-management)
- Hyperkalemia ECG Changes: Peaked T Waves (https://powerfulmedical.com/blog/hyperkalemia-ecg-critical-changes)
- ECG frequency changes in potassium disorders: a narrative review - PMC (https://pmc.ncbi.nlm.nih.gov/articles/PMC9301030)
- ECG T Wave - StatPearls - NCBI Bookshelf (https://ncbi.nlm.nih.gov/books/NBK538264)
- Impending Danger: Evolution of Hyperacute T Waves to Cardiac Arrest (https://cureus.com/articles/432103-impending-danger-evolution-of-hyperacute-t-waves-to-cardiac-arrest)
- Apply Knowledge in ECG Interpretation
- ECG T Wave - StatPearls - NCBI Bookshelf (https://ncbi.nlm.nih.gov/books/NBK538264)
- theneuralcloud.com (https://theneuralcloud.com/post/understanding-peaked-t-waves-in-hyperkalemia-mechanisms-and-management)
- Electrocardiogram - StatPearls - NCBI Bookshelf (https://ncbi.nlm.nih.gov/books/NBK549803)
- How Accurate ECG Interpretation Can Mitigate Healthcare Costs (https://gehealthcare.com/en-ca/insights/article/how-accurate-ecg-interpretation-can-mitigate-healthcare-costs?srsltid=AfmBOoojoXGIvqNXliQaXe2y-D-471xFKOU36t_WMAXjNFuHADINdU1B)