Introduction
Understanding the intricate details of ECG graphs is essential for health tech developers who aim to innovate in cardiac diagnostics. The advancements in automated analysis technologies, such as Neural Cloud Solutions' MaxYield™, present an unprecedented opportunity for enhanced clarity and efficiency in ECG interpretation. However, as these technologies evolve, developers face a critical challenge: how can they effectively capture the nuances of key components like P-waves, QRS complexes, and T-waves? This article explores ten key components of ECG graphs that every health tech developer should know, offering insights into how these elements can be leveraged to improve cardiac care outcomes.
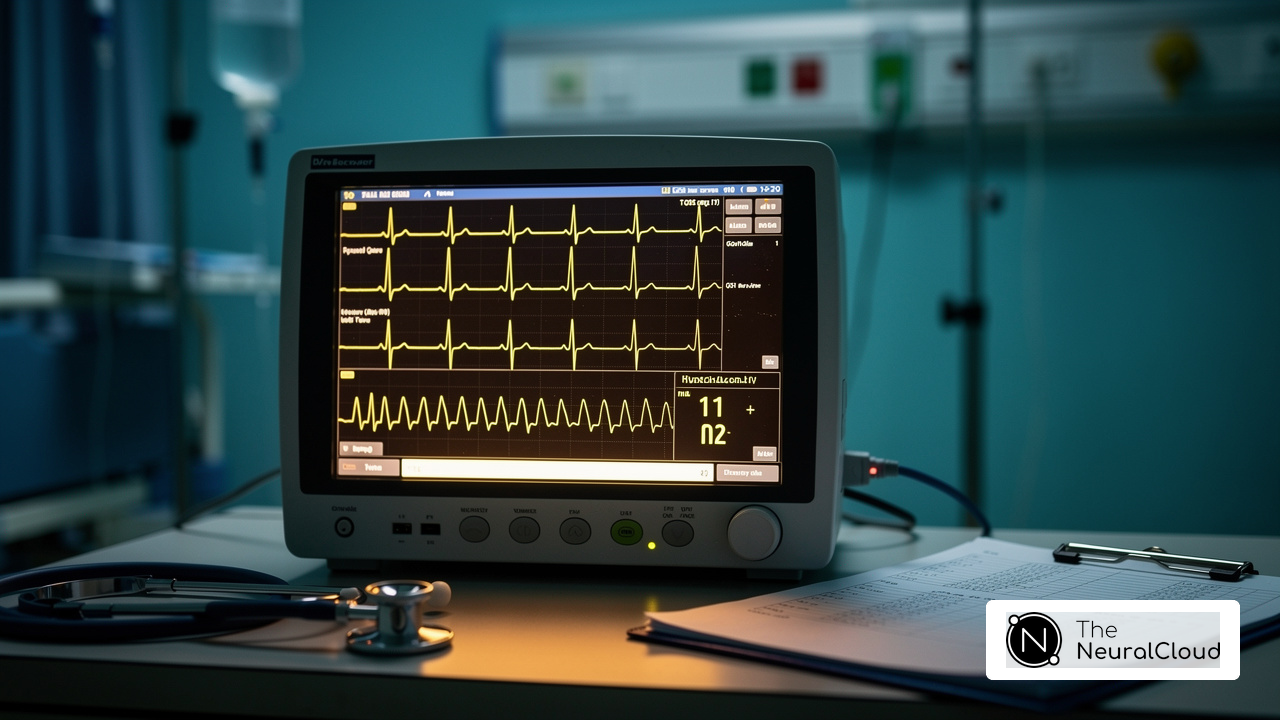
Neural Cloud Solutions' MaxYield™: Automated ECG Analysis for Enhanced Clarity
Neural Cloud Solutions' MaxYield™ is at the forefront of revolutionizing the healthcare industry through automation and enhanced signal clarity. This platform employs advanced algorithms to process over 200,000 heartbeats in under five minutes, delivering precise beat-by-beat evaluations that isolate P-waves, QRS complexes, and T-wave intervals. Such automation not only accelerates the evaluation process but also improves the quality of the ECG graph data, empowering clinicians based on reliable insights from the heart.
The integration of AI significantly enhances the accuracy of ECG analysis and streamlines workflows, enabling clinicians to concentrate on high-level decision-making rather than labor-intensive manual tasks. Recent advancements in technology have led to a notable reduction in turnaround times for interpretations, with some services reporting results in as little as 15 minutes. This rapid evaluation capability is crucial for the healthcare system, particularly in hard-to-reach populations.
Case studies illustrate the substantial impact of AI on both the clarity of the ECG graph and the speed of evaluation. For example, the deployment of mobile ECG recording solutions in nursing homes and mental health facilities has improved access to diagnostic services, reducing the need for individuals with mobility challenges to travel to hospitals. Additionally, healthcare professionals have observed that utilizing AI in the analysis of the ECG graph not only enhances diagnostic accuracy but also optimizes resource allocation, ultimately resulting in enhanced patient care outcomes. As the healthcare environment evolves, the MaxYield™ platform emerges as an indispensable resource for clinicians seeking to leverage technology for superior heart diagnostics.

P-Wave: Understanding Atrial Depolarization in ECG Interpretation
The P-wave is associated with atrial depolarization, which is crucial for diagnosing atrial enlargement and other heart-related abnormalities. Precise detection and interpretation of the P-wave are essential for accurate diagnosis, as its morphology can provide vital insights into various cardiac conditions, including atrial fibrillation and flutter.
Recent studies have underscored the significance of P-wave patterns (PWPs) in assessing atrial function and predicting arrhythmias. For instance, wavelet examination of P waves has proven effective in improving diagnosis and assisting in forecasting paroxysmal atrial fibrillation recurrences in individuals without structural heart disease. Moreover, abnormalities in PWPs reflect distinct pathological processes, emphasizing their clinical utility.
Real-world examples show that extended filtered P wave duration correlates with an increased risk of hospitalization due to atrial fibrillation, highlighting the necessity for early intervention in patients. As cardiologists increasingly recognize the importance of accurate P-wave analysis, integrating solutions like MaxYield™ into tools for ECG graph evaluation can enhance diagnostic precision and improve patient outcomes.
Testimonials from healthcare experts highlight MaxYield™'s ability to analyze data and identify distinct waveforms, facilitating clearer P-wave evaluation and supporting ongoing standardization efforts for PWPs in clinical practice.

QRS Complex: Key Insights into Ventricular Depolarization
The QRS complex is a vital element of the ECG, as it represents the electrical impulses that trigger ventricular depolarization. As the most prominent feature on an ECG, its morphology and duration provide crucial insights into various cardiac conditions, including bundle branch blocks and myocardial infarction. Recent studies underscore the significance of QRS analysis, with algorithms developed to enhance diagnostic precision by analyzing its duration and shape.
In clinical settings, the average QRS duration is approximately 157 ± 40 ms, and variations in this duration can signal underlying pathologies. Current guidelines stress the importance of following standardized protocols for measuring duration on the ECG to ensure accuracy in diagnoses. Moreover, the integration of machine learning techniques, including those utilizing artificial intelligence, shows promise in improving the classification of arrhythmias based on QRS morphology.
Leading cardiologists emphasize that accurate detection of the QRS complex on the ECG is crucial for diagnosing arrhythmias and evaluating overall heart health. They highlight that the ability to distinguish between normal and abnormal QRS patterns can significantly influence treatment decisions. Therefore, developers should prioritize creating algorithms that not only measure but also analyze its morphology to enhance the reliability of interpretations.
Additionally, addressing challenges posed by noise is essential for improving QRS detection precision. Neural Cloud Solutions' MaxYield™ platform excels in this area, employing advanced noise filtering and distinct wave recognition to isolate ECG waves from recordings affected by baseline wander, movement, and muscle artifacts. This capability enables the recovery of previously obscured sections of lengthy Holter, 1-Lead, and patch monitor recordings, ultimately improving diagnostic outcomes.

T Wave: Significance in Cardiac Repolarization Analysis
The T-wave plays a crucial role in indicating the repolarization of the ventricles, and its abnormalities can signal various heart conditions, including ischemia and electrolyte imbalances. Recent studies have shown that T-wave amplitudes, particularly those exceeding 0.183 mV, are strongly linked to underlying cardiomyopathy, especially among younger populations. For example, research involving 5,360 individuals aged 14-35 revealed that 2% exhibited abnormal T-waves, with a significant 13% of those diagnosed with cardiomyopathy. This highlights the critical importance of early detection in preventing sudden cardiac events.
Healthcare professionals emphasize the need for developers to ensure their tools accurately identify T-wave abnormalities, such as inversions and flattening. Dr. Gherardo Finocchiaro has noted that a reliable detection system can significantly alleviate unnecessary anxiety while ensuring timely further testing for those in need.
Furthermore, the predictive value of T-wave changes has been reinforced by findings indicating they are more significant predictors of adverse cardiac events than ST segment depression. This is especially relevant in clinical settings where precise interpretation of the ECG graph can inform critical decision-making. A study examining 31,074 male individuals found that T-wave abnormalities had a higher hazard ratio for cardiovascular events compared to ST segment changes, underscoring their clinical significance.
Integrating advanced algorithms, such as those found in machine learning platforms, into tools for ECG analysis can enhance the identification of these abnormalities. This enables healthcare providers to focus on high-level decision-making rather than manual interpretation. The system's continuous learning model ensures that its algorithms improve over time, increasing accuracy and efficiency in detecting T-wave abnormalities. As the landscape of cardiac health evolves, the capacity to effectively identify T-wave changes through automated, AI-driven solutions will be vital for enhancing outcomes for individuals.
QT Interval: Critical Timing for Heartbeat Analysis
The QT interval is a crucial measurement in the analysis of the ECG graph, representing the duration from the onset of the QRS complex to the conclusion of the T-wave. This interval reflects the total time required for ventricular depolarization and repolarization. Abnormalities in the QT interval, whether extended or reduced, can significantly elevate the risk of arrhythmias, making precise measurement essential for safety. Current guidelines emphasize the importance of monitoring QT intervals, as even minor deviations can lead to serious cardiac events.
Recent studies indicate that up to 20% of individuals scheduled for surgery may have modifiable comorbid conditions that could influence their QT intervals. For instance, a smartphone-enabled device demonstrated 94.4% specificity in predicting patients without prolonged QTc, showcasing the arrhythmia risk assessment.
MaxYield™ exemplifies this potential by employing advanced noise filtering and distinct wave recognition to enhance the efficiency of ECG graph evaluation. By swiftly isolating the ECG graph waves from recordings influenced by noise and artifacts, MaxYield™ ensures that essential data is accurately identified and labeled, which is vital for accurate diagnosis. Additionally, it can recover previously obscured sections of lengthy Holter, 1-Lead, and patch monitor recordings, further enhancing diagnostic capabilities.
Cardiologists emphasize the significance of QT interval monitoring in clinical practice. One expert remarked that it is unacceptable to overlook QT prolongation, highlighting the necessity for careful observation of QT prolongation, particularly in individuals taking medications known to influence cardiac rhythms.
The real-world applications of QT interval monitoring are evident in the development of alert systems, which can alert individuals about potentially dangerous medications based on their QTc measurements. This proactive strategy not only assists in timely medical interventions but also empowers individuals to manage their health more effectively.
Recent advancements in technology include the integration of AI algorithms that enhance the accuracy of QT measurements. For example, a study utilizing over 1.6 million 12-lead EKGs found that AI-enabled devices could match the accuracy of traditional methods, suggesting a paradigm shift in how QT intervals are assessed in clinical settings. As technology progresses, health tech creators should consider utilizing AI tools to improve QT interval analysis, ultimately improving cardiac care and outcomes for individuals.

ST Segment: Identifying Cardiac Conditions through ECG
The ST segment is a critical component of the ECG, as it represents the interval between ventricular depolarization and repolarization. Changes in the ST segment, specifically elevation or depression, serve as key indicators of myocardial ischemia or infarction as seen on an ECG. For example, elevation on the ST segment is often associated with acute myocardial infarction (AMI), while depression on the ST segment may suggest ischemia. Precise detection of these changes is crucial, as prompt identification can significantly influence outcomes for individuals.
Recent research emphasizes the importance of ST segment analysis. A systematic review highlighted that the global prevalence of ST segment changes in individuals under 60 years is approximately 3.8%, underscoring the need for effective diagnosis. Furthermore, the Smith-modified Sgarbossa criteria enhance the diagnosis of occlusive myocardial infarction in individuals with left bundle branch block, illustrating the evolving methodologies in ECG interpretation.
Real-world examples highlight the practical implications of examining the ST segment on the ECG. In one case, an ECG that displayed Pardee waves confirmed myocardial infarction, demonstrating the necessity for health tech developers to be proficient in identifying subtle ST changes. Additionally, new technologies are paving the way for improved diagnostic accuracy of the ST segment, with algorithms achieving an area under the receiver operating characteristic curve (AUROC) of 0.983 for ST-segment elevation (STEMI).
Experts stress the critical nature of these findings. Experts note that the acute occlusion of coronary arteries for extended periods can lead to irreversible myocardial damage, making the prompt recognition of changes in the ST segment essential. Therefore, developers should prioritize designing algorithms that accurately identify these variations, ultimately enhancing care and outcomes. By utilizing Neural Cloud Solutions' MaxYield™, developers can leverage advanced AI technology that transforms noisy ECG recordings into clear waveforms, improving the accuracy of evaluation. MaxYield™'s adaptive algorithms are designed to manage physiological variability and noise, ensuring that critical data is identified and labeled even in challenging recordings. This capability not only streamlines workflow but also enhances diagnostic accuracy, ultimately benefiting patient care.

Heart Rate Calculation: Essential for ECG Interpretation
Accurate heart rate calculation is fundamental for interpreting the ECG, which is primarily derived from the R-R interval. Fluctuations in heart rate can indicate different heart conditions, making it crucial for developers to ensure their ECG analysis tools can reliably compute and present this information. Current guidelines emphasize using standardized methods for heart rate calculation to enhance diagnostic accuracy. For instance, a decrease in heart rate variability, particularly with metrics such as SDNN below 50 ms, has been associated with increased mortality, especially in individuals with heart failure. This underscores the necessity for accurate monitoring.
Real-world examples demonstrate that heart rate variations can signify important clinical events, such as arrhythmias or ischemic episodes. Cardiologists have observed that comprehending these variations is essential for effective patient management, as they offer insights into the autonomic nervous system's regulation of heart function. The 'Neural Cloud Solutions' platform transforms the evaluation of the ECG graph by integrating advanced noise filtering and distinct wave recognition abilities. This enables the swift isolation of ECG waves from recordings affected by baseline wander, movement, and muscle artifacts.
Such features ensure that insights based on the ECG graph are derived from clear and precise data, which is crucial for identifying significant heart events. Incorporating strong features into ECG analysis tools, especially those enhanced by MaxYield™, is essential for clinicians to make informed choices based on precise heart insights. The platform not only improves the accuracy of interpretations but also aids in delivering better patient outcomes through enhanced monitoring.

Cardiac Axis: Understanding Normal and Deviated Patterns
The heart's axis represents the overall direction of its electrical activity, typically ranging from -30 to +90 degrees in healthy individuals. A normal axis indicates proper heart function, while deviations can signal underlying conditions such as left ventricular hypertrophy or conduction blocks. For instance, left axis deviation (LAD) occurs when the axis is less than -30 degrees and is commonly associated with structural heart diseases, alerting healthcare professionals to potential complications. Conversely, right axis deviation (RAD), defined as an axis exceeding +90 degrees, may indicate right ventricular hypertrophy or other severe heart conditions.
Recent studies underscore the clinical implications of these deviations. Patients with LAD and left bundle branch block may experience reduced benefits from certain treatments, emphasizing the need for thorough assessment of axis deviations in treatment planning. Furthermore, research indicates that axis deviations are particularly concerning in heart transplant recipients. This correlation emphasizes the importance of integrating clinical context when interpreting the ECG graph findings.
To ascertain the heart axis, leads I and aVF are examined:
- Both positive signifies a normal axis
- I positive and aVF negative signifies left deviation
- I negative and aVF positive signifies right deviation
- Both negative signifies extreme deviation
Healthcare professionals emphasize the importance of the heart axis, as it acts as a vital diagnostic indicator. Developers should concentrate on forming algorithms able to analyze ECG data, utilizing Neural Cloud Solutions' technology to enhance diagnostic capabilities and improve outcomes for individuals.
This model evolves with each use, continuously improving accuracy and efficiency, which is crucial for patient care. By addressing challenges such as physiological variability and signal artifacts, advancements in ECG analysis can significantly impact clinical decision-making. It is essential to prioritize this aspect of the diagnostic process.

Bundle Branch Block: Implications for ECG Analysis
Bundle branch blocks (BBBs) result from delays or blockages in the electrical conduction pathways to the ventricles, leading to distinctive alterations in the heart rhythm on an ECG graph. These changes serve as critical indicators of potential underlying heart disease, making accurate detection essential for healthcare providers. Recent studies highlight the variability in heart failure risk among individuals with left bundle branch block (LBBB), emphasizing the importance of advanced analytical tools in stratifying this risk. For example, research has shown that algorithms can effectively identify variations in the ECG graph that present LBBB, significantly enhancing predictive capabilities for heart failure admissions.
The real-world applications of this research indicate that developers must ensure their tools for ECG analysis can reliably detect these blocks. Recognizing QRS changes associated with BBBs not only assists in diagnosing heart conditions but also informs treatment strategies, as illustrated on an ECG graph. As Ryuichiro Yagi, MD, MPH, noted, the AI model's ability to categorize heart failure risk from a single 12-lead ECG graph demonstrates significant clinical value in managing individuals with LBBB. Testimonials from users of the MaxYield™ platform further validate its effectiveness in transforming noisy recordings into clear signals. This underscores the necessity for developers to incorporate robust algorithms that enhance detection, ultimately improving outcomes for patients.
The functionality of MaxYield™ evolves with each use, continuously refining its algorithms to adapt to new data, thereby enhancing its diagnostic capabilities. By integrating features that allow for real-time analysis and feedback, MaxYield™ not only improves the interpretation of the ECG graph but also empowers healthcare professionals with actionable insights. This platform stands out by providing a comprehensive solution that addresses the challenges faced in ECG interpretation, ensuring that clinicians can make informed decisions based on accurate data.

Noise Reduction Techniques: Enhancing ECG Signal Clarity
can significantly obscure true ECG signals, potentially leading to misinterpretations that may jeopardize patient care. Techniques such as filtering and adaptive algorithms are essential for improving accuracy and ensuring accurate readings. Recent advancements in technology, including the EEMD_EMD_WP method, have shown remarkable effectiveness in improving signal-to-noise ratios while preserving the integrity of the original ECG data. This technique effectively removes noise, powerline interference, and muscle artifacts, which are common obstacles in ECG evaluation.
Healthcare professionals underscore the importance of noise reduction. A survey revealed that 53 percent of clinicians experience difficulties in interpreting remote ECGs, highlighting the necessity for effective noise reduction techniques. By prioritizing these techniques in ECG analysis, developers can enhance the reliability of readings, ultimately leading to improved patient outcomes. The integration of algorithms, which adjust in real-time to varying noise characteristics, further enhances the clarity of ECG signals, making it a vital consideration for health tech developers focused on patient care.

Conclusion
Understanding the key components of ECG graphs is crucial for health tech developers who aim to enhance cardiac diagnostics. By focusing on elements such as:
- P-wave
- QRS complex
- T-wave
- QT interval
- ST segment
- Heart rate calculations
- Cardiac axis
- Bundle branch blocks
- Noise reduction techniques
developers can create tools that improve the accuracy and efficiency of ECG interpretations. For instance, platforms like Neural Cloud Solutions' MaxYield™ illustrate how automation and AI can streamline evaluations, providing healthcare professionals with clearer insights and quicker results.
Each ECG component serves a significant purpose:
- The P-wave aids in diagnosing atrial conditions.
- The QRS complex and T-wave are essential for evaluating ventricular health and predicting serious cardiac events.
- Accurate assessments of the QT interval and ST segment are vital for detecting critical heart issues.
- Dependable heart rate calculations and cardiac axis evaluations offer additional context for overall heart function.
- Furthermore, advancements in noise reduction techniques enhance the clarity and reliability of ECG readings.
In conclusion, mastering these ECG components is imperative for advancing cardiac health technology. Developers should utilize these insights to integrate robust features into their ECG analysis tools, with an emphasis on accuracy and clarity. This dedication will not only improve patient care and outcomes but also pave the way for a future where precise and timely cardiac diagnostics become standard practice. Embracing these advancements is essential for enhancing cardiac health monitoring and treatment.
Frequently Asked Questions
What is Neural Cloud Solutions' MaxYield™ platform?
MaxYield™ is an advanced platform that automates ECG analysis, enhancing signal clarity and processing over 200,000 heartbeats in under five minutes for precise beat-by-beat evaluations.
How does MaxYield™ improve ECG evaluation?
The platform employs AI algorithms to isolate critical features of the ECG graph, such as P-waves, QRS complexes, and T-wave intervals, which accelerates the evaluation process and improves data quality.
What are the benefits of using AI in ECG analysis?
AI enhances ECG graph clarity, reduces evaluation turnaround times, and allows healthcare professionals to focus on high-level decision-making rather than manual tasks, ultimately improving patient care outcomes.
How quickly can ECG interpretations be provided using MaxYield™?
Some services using MaxYield™ can report ECG results in as little as 15 minutes, which is crucial for timely diagnosis and treatment of serious cardiac conditions.
What role does the P-wave play in ECG interpretation?
The P-wave indicates electrical activity associated with atrial depolarization, which is vital for diagnosing conditions like atrial enlargement, atrial fibrillation, and flutter.
Why are P-wave parameters important in clinical practice?
P-wave parameters (PWPs) help assess atrial function and predict arrhythmias, providing insights into various cardiac conditions and reflecting distinct pathological processes.
What insights can the QRS complex provide?
The QRS complex represents ventricular depolarization, and its morphology and duration are crucial for diagnosing conditions such as bundle branch blocks and myocardial infarction.
What is the average duration for the QRS complex in clinical settings?
The average QRS duration is approximately 157 ± 40 ms, with variations potentially signaling underlying pathologies.
How does MaxYield™ address challenges in ECG evaluation?
MaxYield™ employs advanced noise filtering and distinct wave recognition to isolate ECG waves from recordings affected by artifacts, enhancing the efficiency and accuracy of ECG analysis.
What is the significance of accurate QRS complex detection?
Accurate detection is essential for diagnosing arrhythmias and evaluating overall heart health, influencing treatment decisions significantly.
List of Sources
- Neural Cloud Solutions' MaxYield™: Automated ECG Analysis for Enhanced Clarity
- ecg-od.com (https://ecg-od.com/case_studies/bradford-district-care-foundation-use-of-ecg-on-demands-ai-assisted-12-lead-ecg-interpretation-service)
- P-Wave: Understanding Atrial Depolarization in ECG Interpretation
- pmc.ncbi.nlm.nih.gov (https://pmc.ncbi.nlm.nih.gov/articles/PMC4779233)
- ahajournals.org (https://ahajournals.org/doi/10.1161/CIRCEP.121.010435)
- jacc.org (https://jacc.org/doi/10.1016/S0735-1097(02)02981-9)
- QRS Complex: Key Insights into Ventricular Depolarization
- researchgate.net (https://researchgate.net/publication/396197781_A_Comprehensive_Evaluation_of_Publicly_Available_QRS_Detection_Algorithms_for_ECG_Analysis)
- nature.com (https://nature.com/articles/s41598-025-93906-5)
- nature.com (https://nature.com/articles/s43856-024-00725-2)
- mdpi.com (https://mdpi.com/2076-3417/14/21/10078)
- T Wave: Significance in Cardiac Repolarization Analysis
- pmc.ncbi.nlm.nih.gov (https://pmc.ncbi.nlm.nih.gov/articles/PMC6932391)
- medicalxpress.com (https://medicalxpress.com/news/2025-07-clues-heart-rhythm-sudden-death.html)
- link.springer.com (https://link.springer.com/article/10.1007/s00125-020-05337-8)
- citystgeorges.ac.uk (https://citystgeorges.ac.uk/news-and-events/news/2025/july/new-clues-from-heart-rhythm-test-could-prevent-sudden-death-in-under-35s)
- QT Interval: Critical Timing for Heartbeat Analysis
- researchgate.net (https://researchgate.net/publication/346113079_Artificial_Intelligence_Machine_Learning_and_Reasoning_in_Health_Informatics-Case_Studies)
- newsnetwork.mayoclinic.org (https://newsnetwork.mayoclinic.org/discussion/mayo-clinic-research-yields-breakthrough-in-mobile-determination-of-qt-prolongation)
- thryvtrx.com (https://thryvtrx.com/news/positive-topline-results)
- patientsafetysolutions.com (https://patientsafetysolutions.com/tip_of_the_week_archive_apr-jun_2020)
- ST Segment: Identifying Cardiac Conditions through ECG
- sciencedirect.com (https://sciencedirect.com/science/article/pii/S0196064424012502)
- ncbi.nlm.nih.gov (https://ncbi.nlm.nih.gov/books/NBK537076)
- nature.com (https://nature.com/articles/s41598-024-67532-6)
- pmc.ncbi.nlm.nih.gov (https://pmc.ncbi.nlm.nih.gov/articles/PMC8585962)
- bmccardiovascdisord.biomedcentral.com (https://bmccardiovascdisord.biomedcentral.com/articles/10.1186/s12872-023-03231-w)
- Heart Rate Calculation: Essential for ECG Interpretation
- mmaglobal.com (https://mmaglobal.com/case-study-hub/case_studies/view/36587)
- Checking your browser - reCAPTCHA (https://pmc.ncbi.nlm.nih.gov/articles/PMC5624990)
- sciencedirect.com (https://sciencedirect.com/science/article/abs/pii/S0033062025000817)
- Cardiac Axis: Understanding Normal and Deviated Patterns
- emra.org (https://emra.org/students/newsletter-articles/guide-for-reading-ekgs)
- geekymedics.com (https://geekymedics.com/what-is-cardiac-axis)
- droracle.ai (https://droracle.ai/articles/119890/what-do-axis-deviations-on-ecg-mena)
- Bundle Branch Block: Implications for ECG Analysis
- scribd.com (https://scribd.com/document/862713389/PUNTO-6-INNOVATION)
- ahajournals.org (https://ahajournals.org/doi/abs/10.1161/circ.150.suppl_1.4114276)
- Noise Reduction Techniques: Enhancing ECG Signal Clarity
- ietresearch.onlinelibrary.wiley.com (https://ietresearch.onlinelibrary.wiley.com/doi/10.1049/sil2.12232)
- fastercapital.com (https://fastercapital.com/content/Noise-Reduction--Enhancing-Signal-Clarity-with-Noise-Reduction-Smoothing.html)
- bookey.app (https://bookey.app/book/the-ecg-made-easy/quote)
- researchgate.net (https://researchgate.net/publication/390404125_Effectiveness_of_Advanced_ECG_Noise_Reduction_Filters)
- diagnosticimaging.com (https://diagnosticimaging.com/view/fda-new-electrocardiogram-suite-algorithms-and-analytics)