Overview
The article serves as a comprehensive guide for mastering EKG axis calculation, highlighting its critical role in cardiac diagnostics. It delineates the normal range for EKG axis, outlines the steps for accurate calculation, and discusses the implications of deviations. Clinical examples are provided to illustrate these concepts, alongside the integration of advanced tools such as MaxYield™. This platform significantly enhances accuracy and efficiency in EKG analysis, offering healthcare professionals a robust resource for improving diagnostic outcomes.
Introduction
Understanding the EKG axis is essential for interpreting the heart's electrical activity and identifying potential cardiac issues. This guide provides a systematic approach to mastering EKG axis calculation, enabling healthcare professionals to enhance their diagnostic skills. Given the various deviations that suggest different underlying conditions, it is vital to ensure accurate interpretation amid the complexities of EKG readings. By grasping these concepts, professionals can improve their analytical capabilities and ultimately contribute to better patient outcomes.
Understand the Basics of EKG Axis
The orientation of the EKG axis indicates the general path of electrical activity in the heart, as recorded by an electrocardiogram. Typically measured in degrees, a normal orientation ranges from -30° to +90°. Grasping the reference line is crucial for identifying potential abnormalities in heart function, such as left or right deviation, which can signal underlying cardiac issues. The orientation is established by examining the QRS complex in particular leads, mainly Lead I and Lead aVF, to evaluate the net electrical activity of the heart.
Neural Cloud Solutions' MaxYield™ platform enhances this analysis by automating the labeling process, significantly reducing operational costs and improving efficiency. With advanced noise filtering and distinct wave recognition, MaxYield™ can isolate ECG waves even in recordings with high levels of noise and artifact, ensuring that critical data is accurately identified and labeled. This capability is essential for addressing the challenges posed by physiological variability and signal artifacts, which can complicate traditional ECG interpretation methods.
Key Concepts:
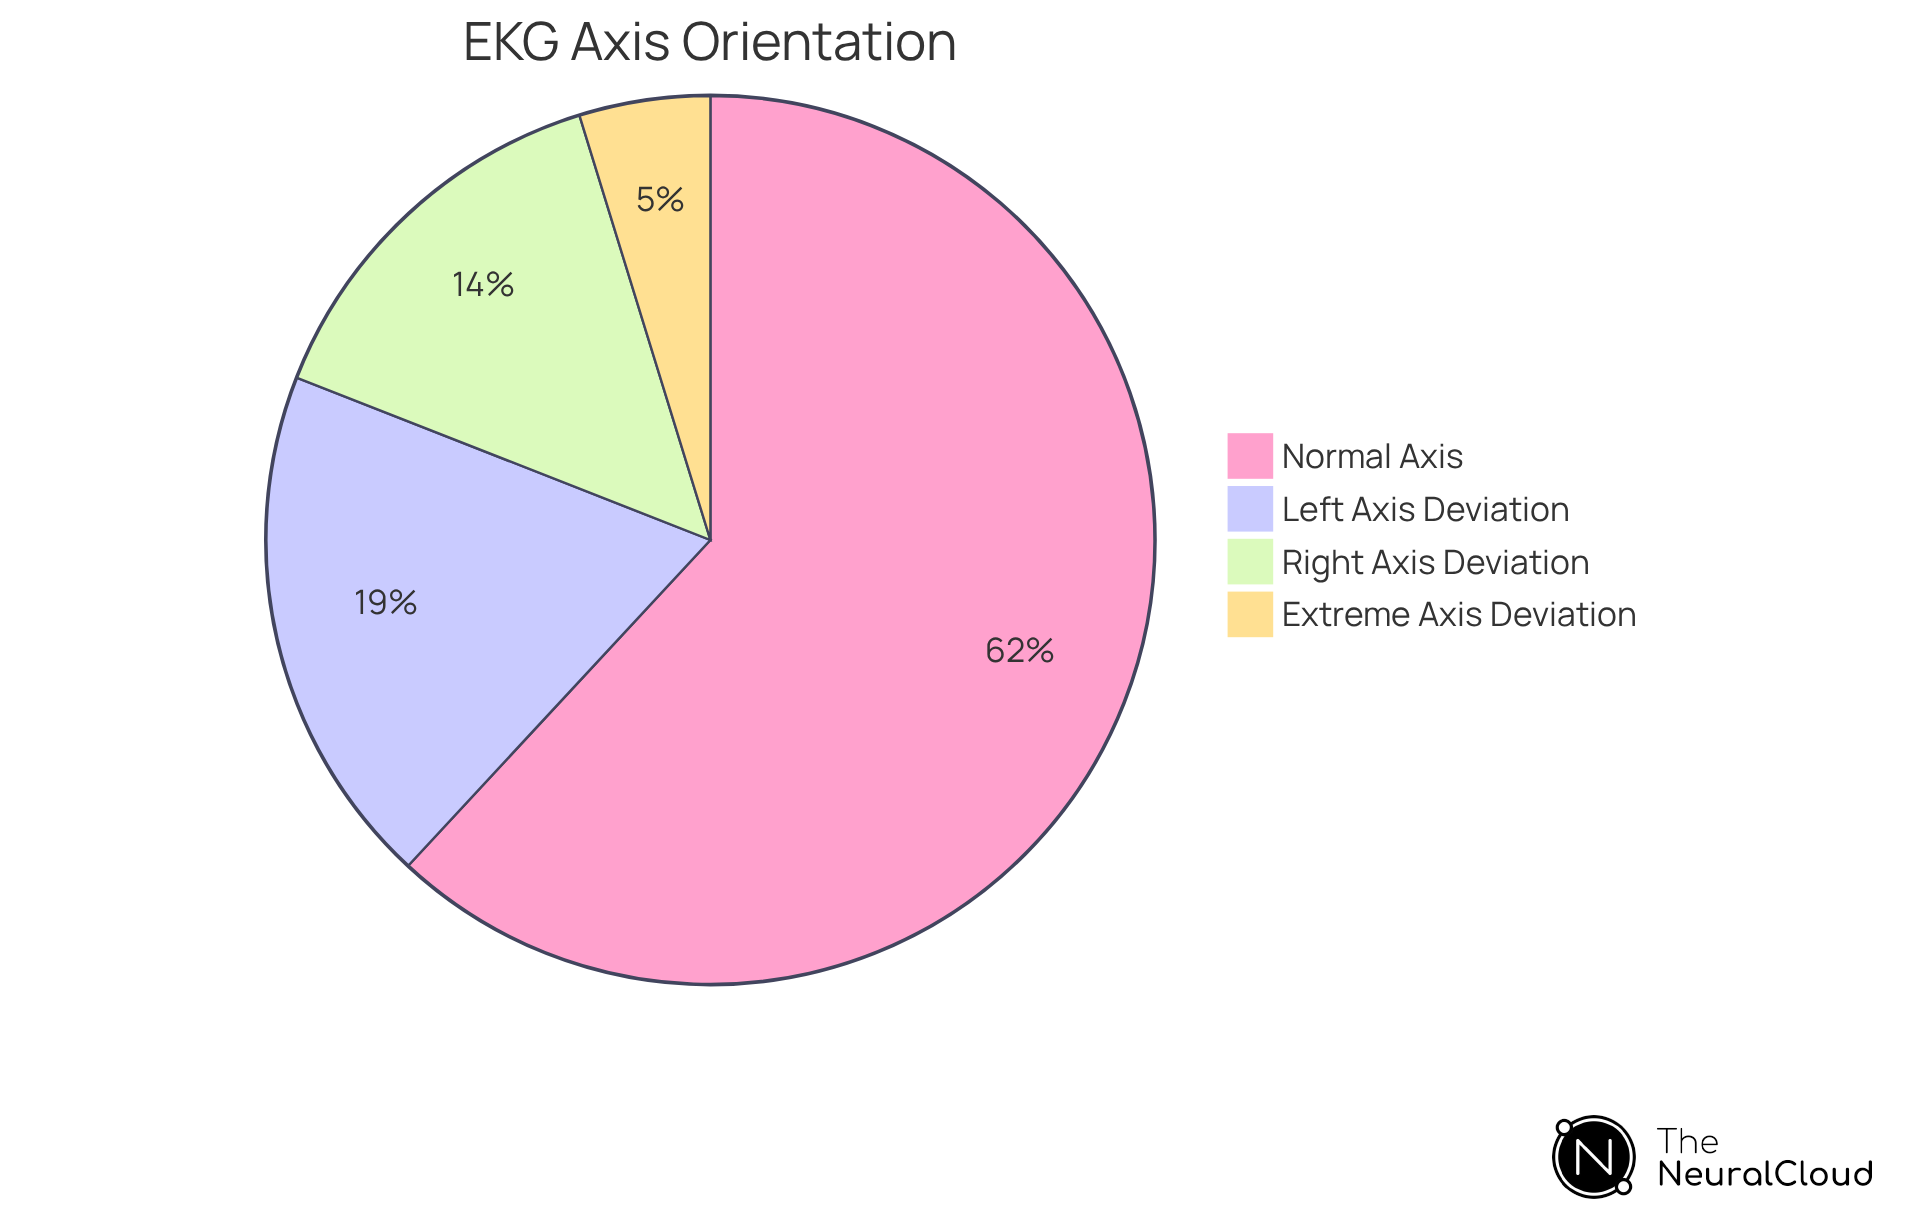
- Normal Axis: Between -30° and +90°.
- Left Axis Deviation (LAD): Less than -30°, often associated with conditions such as left ventricular hypertrophy or inferior myocardial infarction. In clinical settings, LAD is observed in approximately 20% of patients with significant cardiac conditions.
- Right Axis Deviation (RAD): Greater than +90°, frequently seen in cases of right ventricular hypertrophy or pulmonary conditions. Studies indicate that RAD can occur in up to 15% of patients with chronic lung disease.
- Extreme Axis Deviation: Ranges from -90° to +180°, which may indicate severe underlying pathology.
The significance of the EKG axis in cardiac diagnostics cannot be overstated. The EKG axis serves as a subtle yet critical indicator of potential cardiac dysfunction. For example, a study discovered that almost 20% of patients admitted with different cardiac conditions displayed an irregular QRS orientation, emphasizing the necessity for thorough assessment. Cardiologists stress that although deviations in the EKG axis may not be life-threatening on their own, they can indicate serious underlying issues that require further examination.
Real-world examples demonstrate the importance of direction determination: a patient with right deviation may show symptoms of pulmonary embolism, while another with left deviation could be experiencing myocardial infarction. These cases underscore the necessity of accurate interpretation of the EKG axis for effective patient management. With the integration of MaxYield™, health tech developers can leverage to enhance the accuracy and efficiency of EKG analysis, leading to more informed clinical decision-making.

Gather Necessary Tools and Resources
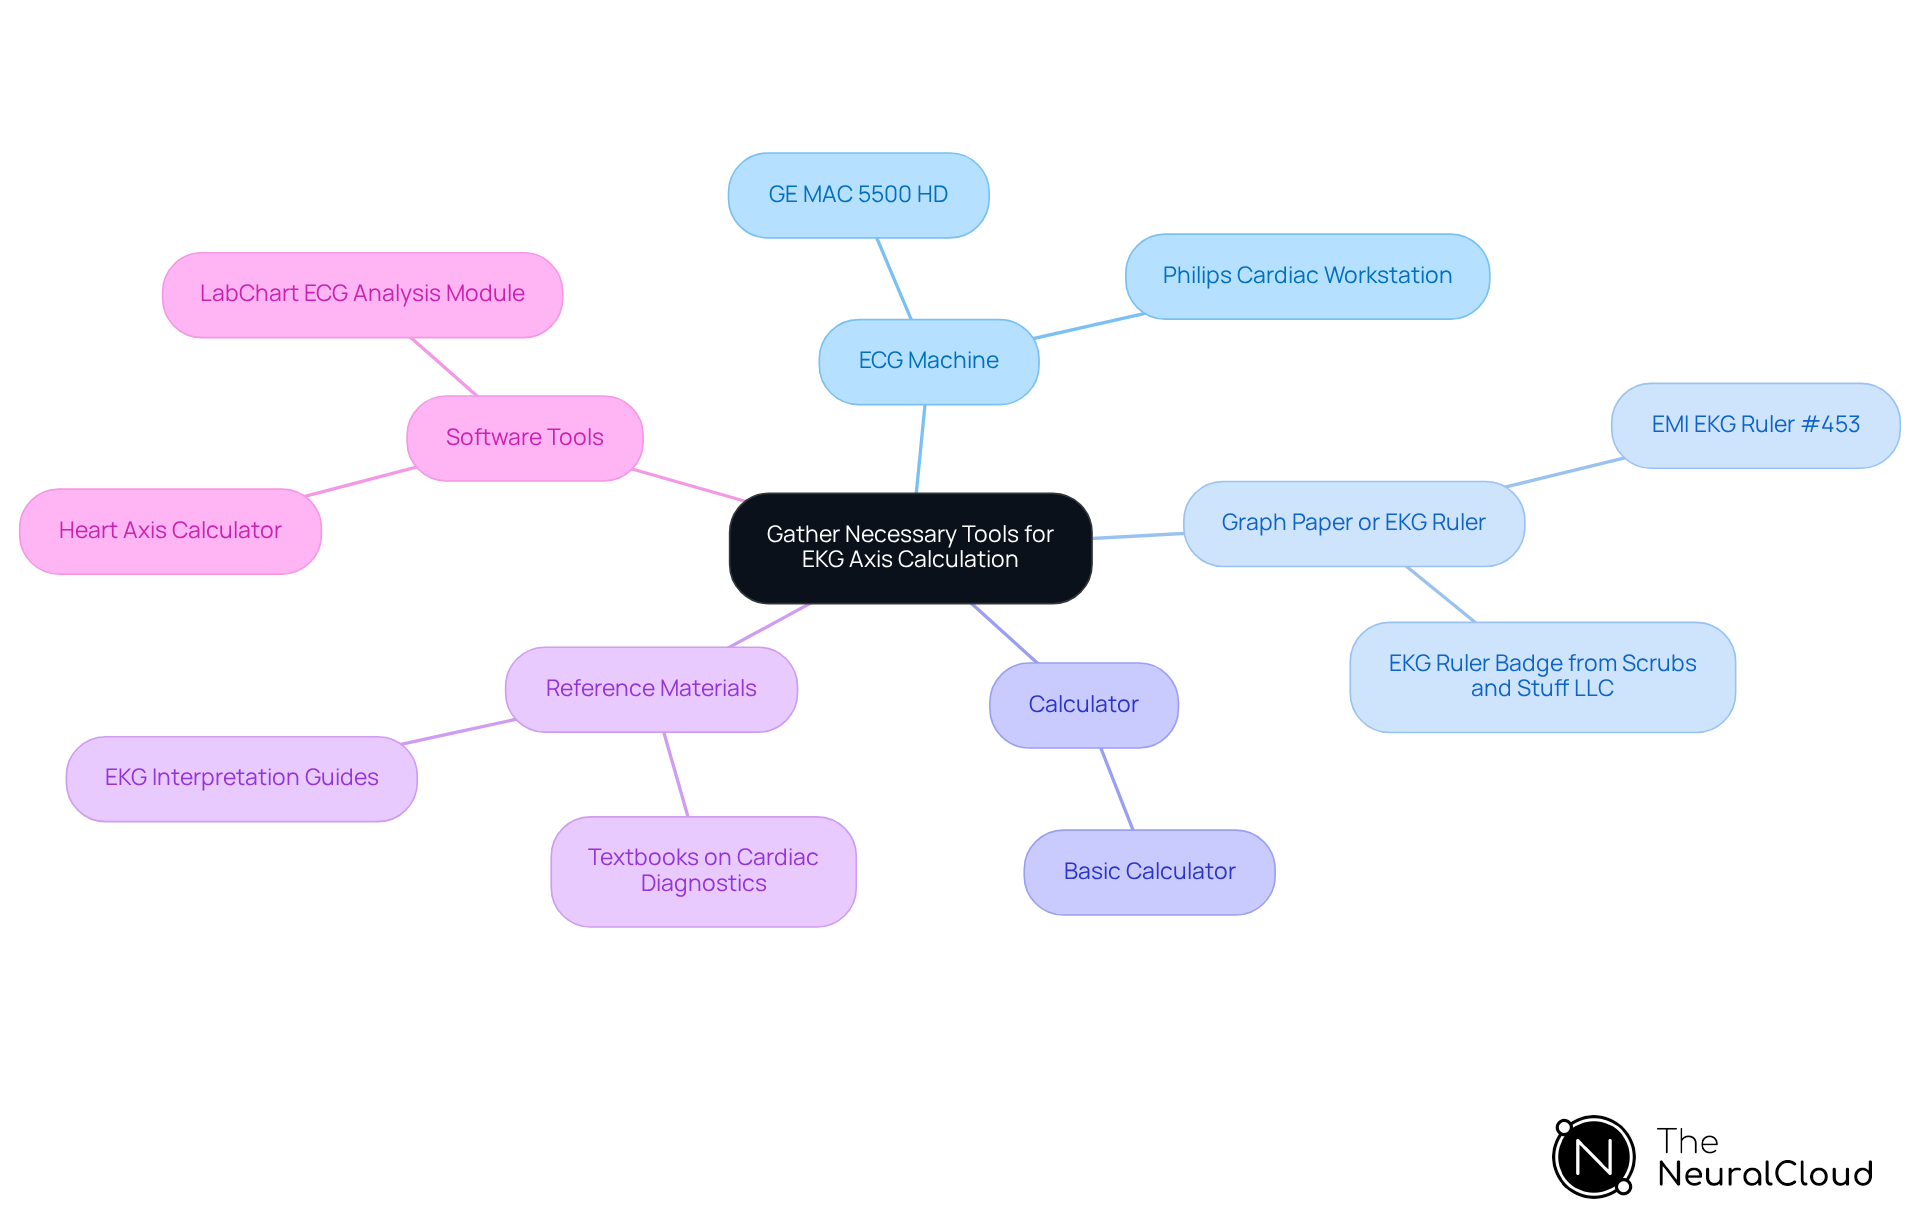
To accurately calculate the EKG axis, gather the following essential tools and resources:
- Electrocardiogram (ECG) Machine: Utilize a high-quality ECG machine capable of delivering a clear 12-lead EKG. Machines like the GE MAC 5500 HD and Philips Cardiac Workstations are known for their reliability and advanced diagnostic capabilities, ensuring precise data collection.
- Graph Paper or EKG Ruler: Employ graph paper or an EKG ruler to measure the amplitude of the QRS complexes accurately. The EMI EKG Ruler #453, for instance, is designed for ease of use in clinical settings, making it a practical choice for measuring various EKG intervals.
- Calculator: A basic calculator is essential for performing the arithmetic calculations needed in coordinate determination.
- Reference Materials: Access to EKG interpretation guides or textbooks will provide valuable insights and examples, enhancing your understanding of the process.
- Software Tools: Consider utilizing software applications or online calculators, such as the Heart Axis Calculator, which can automate aspects of direction calculation. These tools can greatly enhance precision and efficiency, as studies suggest that visual estimations of the QRS direction can correlate closely with calculated values, achieving a precision of approximately 10°.
Having these tools available will simplify the calculation process and improve the precision of your determinations related to the EKG axis.

Calculate the EKG Axis Step-by-Step
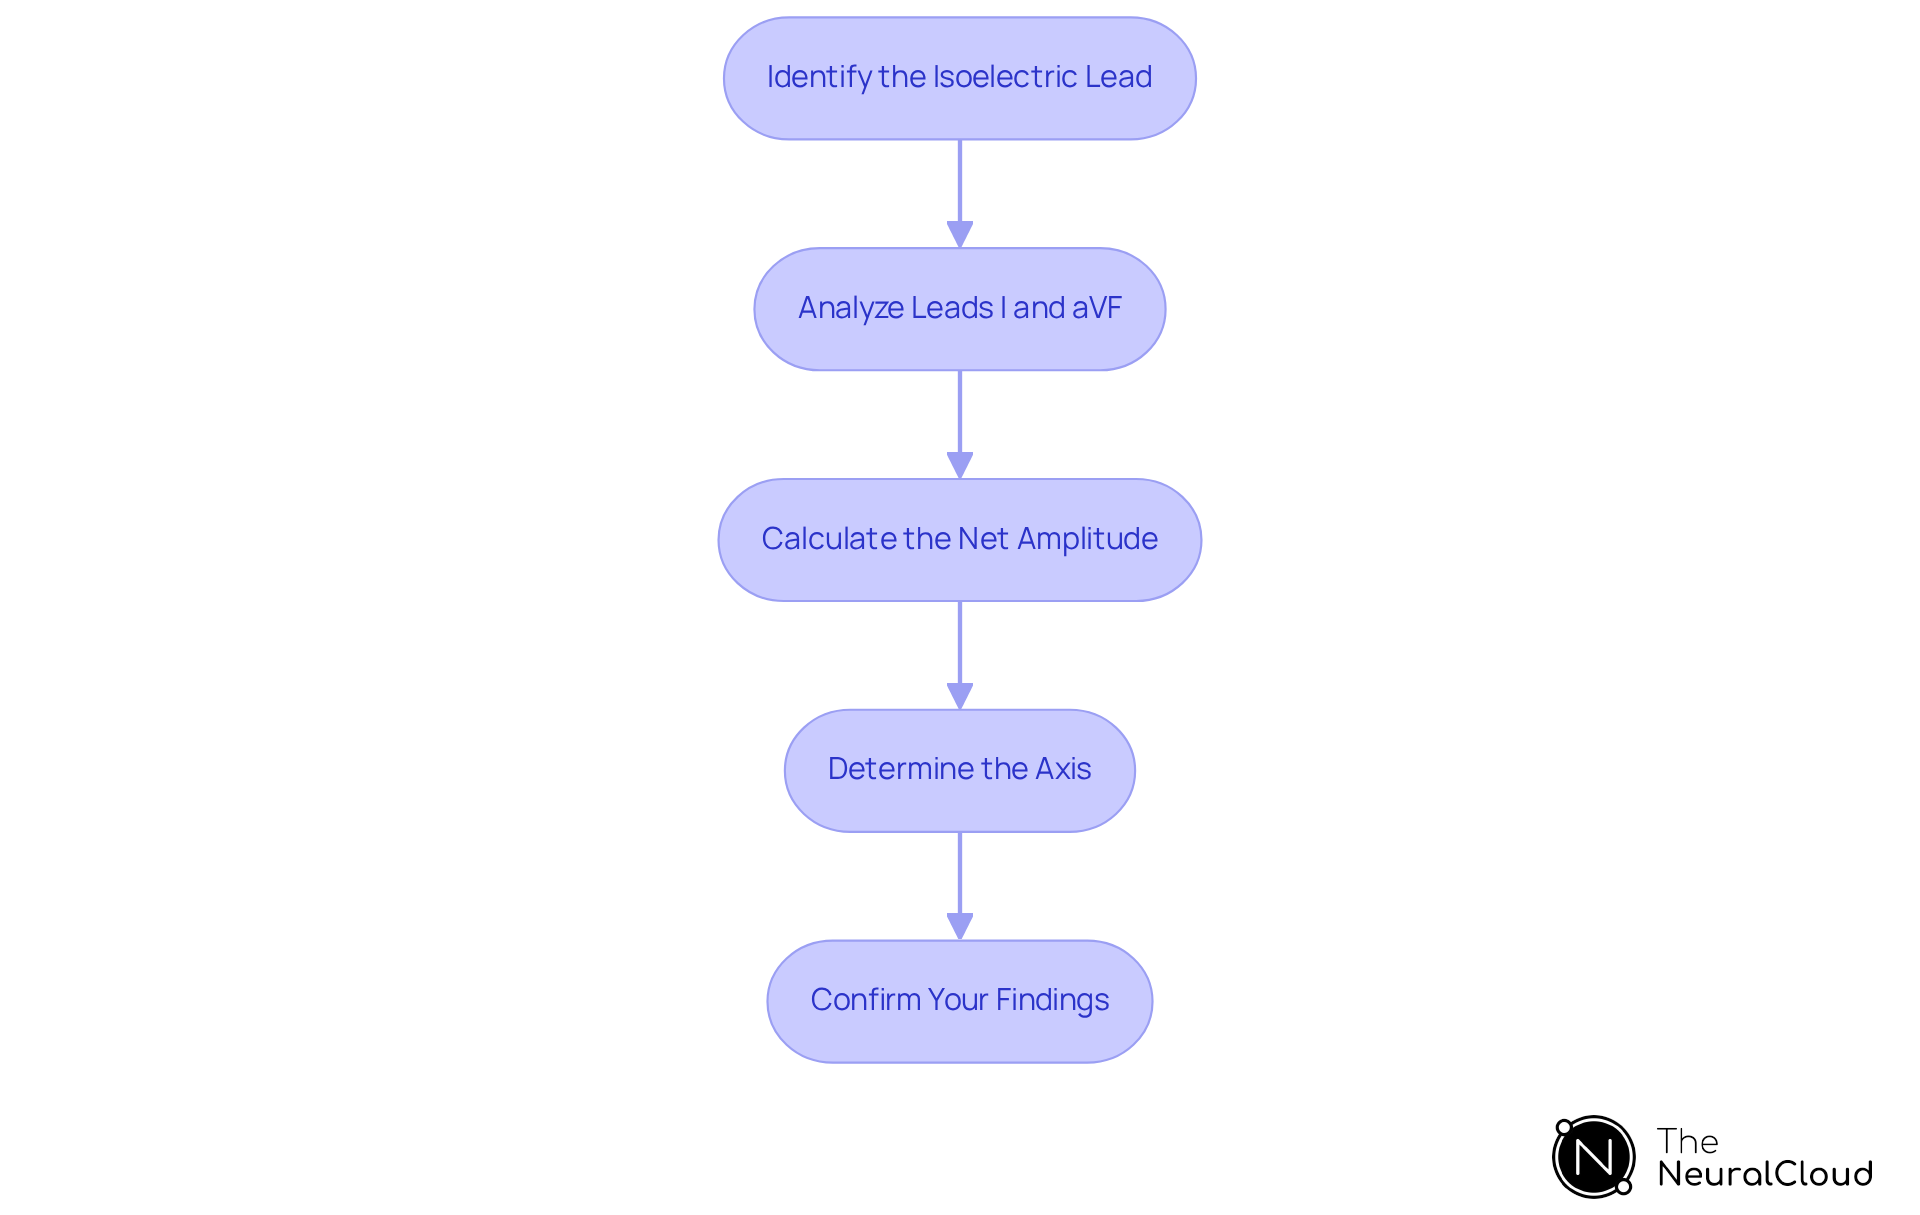
To accurately calculate the EKG axis, follow these systematic steps, enhanced by the capabilities of MaxYield™ for improved clarity and efficiency:
Step 1: Identify the Isoelectric Lead
- Examine the QRS complexes in the limb leads to find the lead where the QRS is nearly flat (isoelectric). This connection is essential for identifying the EKG axis. With MaxYield™, you can swiftly , even in recordings with significant levels of noise and artifact.
Step 2: Analyze Leads I and aVF
- Evaluate the QRS complex in Lead I and Lead aVF:
- If both leads display positive QRS complexes, the axis is considered normal.
- If Lead I is positive and Lead aVF is negative, this suggests a left deviation in the EKG axis.
- If Lead I is negative and Lead aVF is positive, this indicates a right deviation of the EKG axis.
- If both inputs are negative, this signifies a severe deviation of the EKG axis.
Step 3: Calculate the Net Amplitude
- Measure the amplitudes of the R wave, Q wave, and S wave in the identified leads using the formula:
- Net Amplitude = R wave amplitude - (Q wave amplitude + S wave amplitude)
Step 4: Determine the Axis
- Utilize the net amplitude to plot the axis on a hexaxial reference system or employ a calculator to ascertain the exact degree of the axis based on the net deflection. MaxYield™ enhances this process by evolving its algorithms with each use, ensuring maximum diagnostic yield.
Step 5: Confirm Your Findings
- Validate your results against standard EKG interpretation guidelines to ensure accuracy. The advanced noise filtering and distinct wave recognition capabilities of MaxYield™ allow for the salvage of previously obscured sections of lengthy Holter and patch monitor recordings, further supporting your findings.
Additional Insights
- A recent study involving 108 patients confirmed that visual estimation of the QRS axis can achieve an accuracy of 10°, making it a reliable method for clinical applications. This method is especially beneficial in recognizing deviations in alignment, which can happen often in different groups, including those with issues such as hypertension and obesity.
- Cardiologists emphasize the importance of understanding normal EKG features to recognize deviations that may indicate abnormalities. By mastering these steps and leveraging MaxYield™, healthcare professionals can enhance their diagnostic capabilities and improve patient outcomes.

Troubleshoot Common Issues in EKG Axis Determination
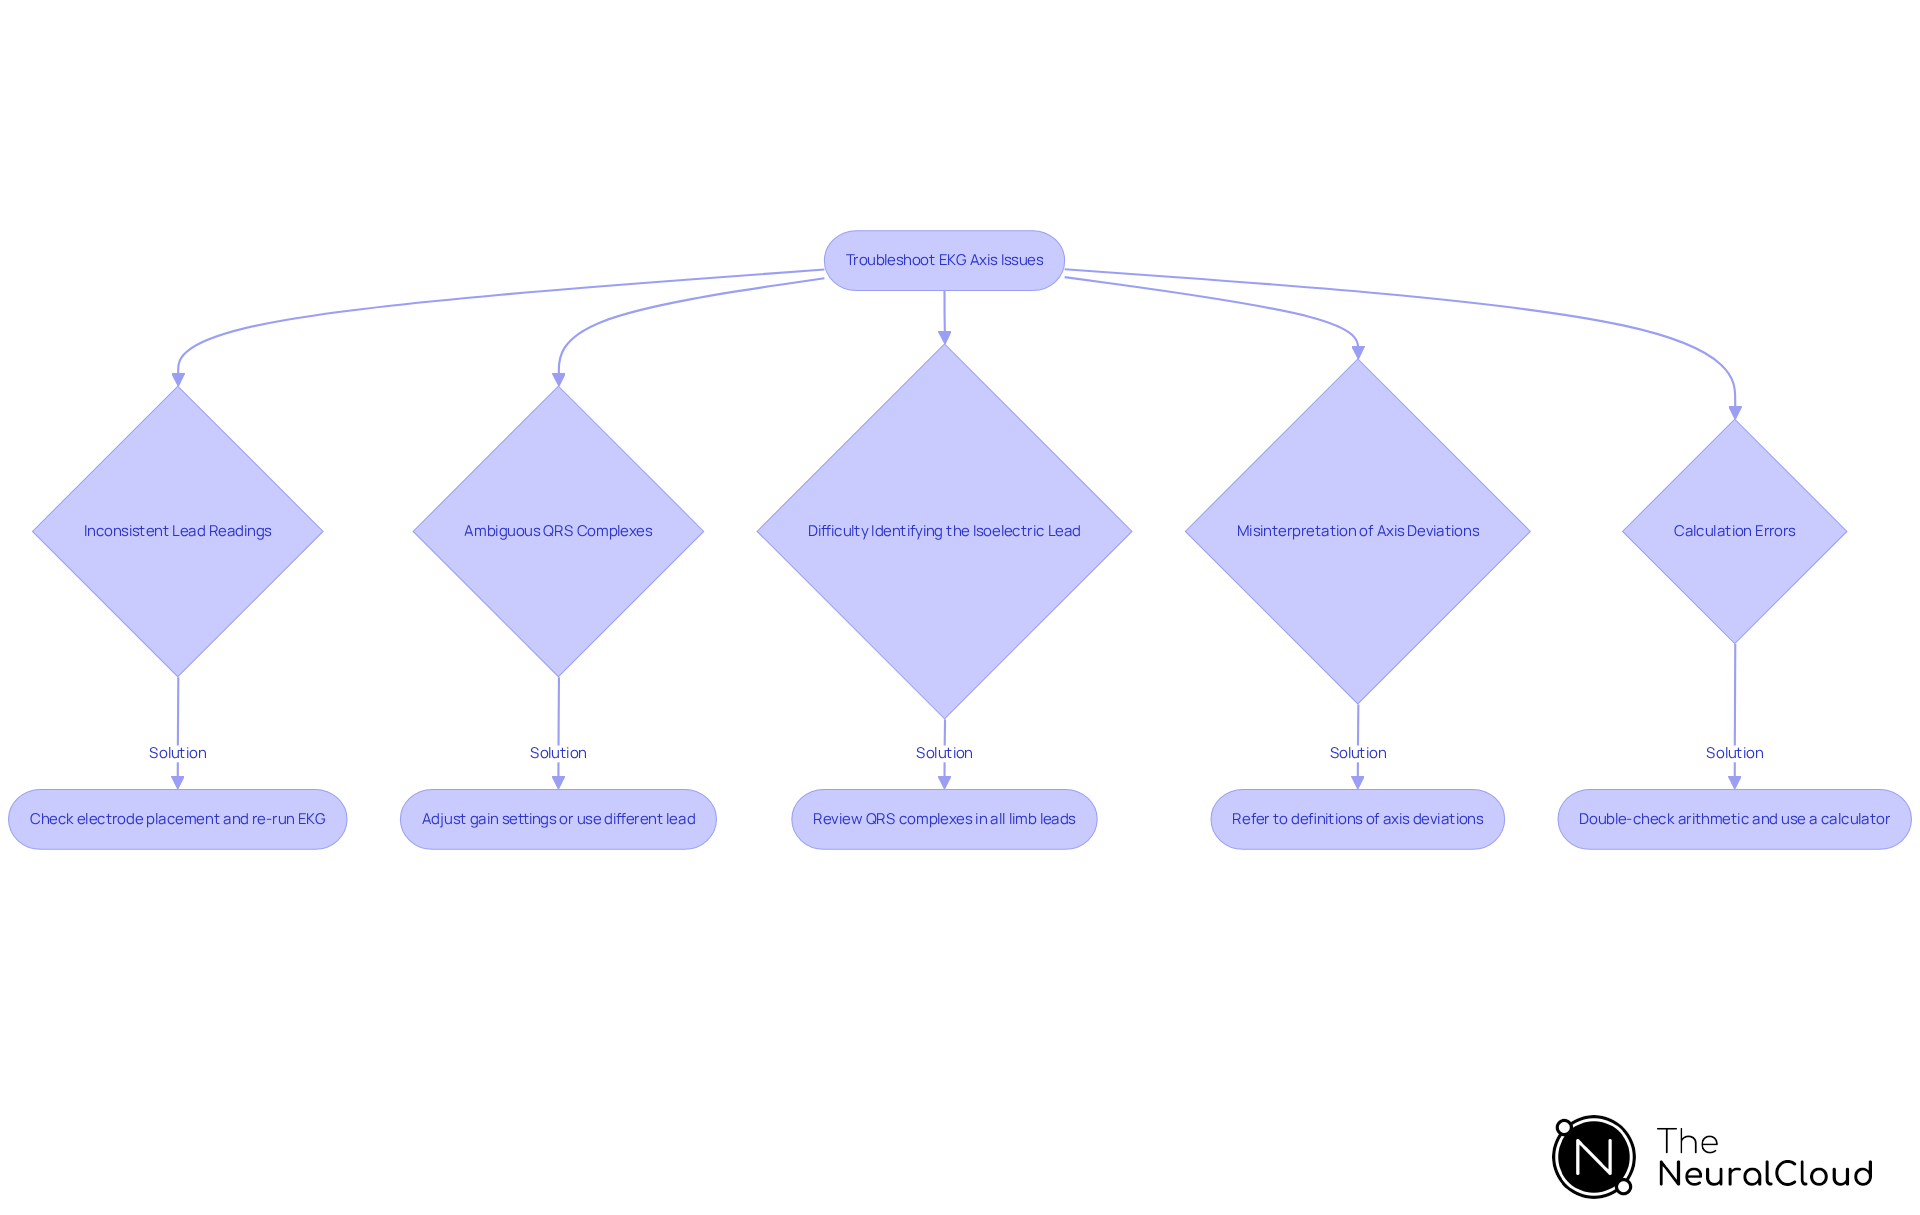
Several common issues may arise when calculating the EKG axis. Here’s how to troubleshoot them effectively:
- Issue 1: Inconsistent Lead Readings
Ensure proper electrode placement and check for any lead misplacement. Statistics suggest that electrode misplacement can significantly impact EKG accuracy, so re-running the EKG may be necessary to obtain trustworthy results. - Issue 2: Ambiguous QRS Complexes
If the QRS complexes are unclear, consider adjusting the gain settings on the ECG machine or using a different lead for analysis. This adjustment can help clarify the waveform and improve interpretation. - Issue 3: Difficulty Identifying the Isoelectric Lead
If you struggle to find the isoelectric lead, systematically review the QRS complexes in all limb leads. Leads may appear equiphasic, which can assist in identifying the orientation more precisely. - Issue 4: Misinterpretation of Axis Deviations
Familiarize yourself with the definitions of normal, left, right, and extreme axis deviations. Reference materials can be invaluable in confirming your interpretations and ensuring accuracy in your assessments. - Issue 5: Calculation Errors
Double-check your arithmetic when calculating net amplitudes. Utilizing a calculator can help minimize errors and of your calculations.
By addressing these common issues with systematic troubleshooting, healthcare professionals can improve the accuracy of EKG axis determination, ultimately resulting in better patient outcomes.

Conclusion
Mastering the calculation of the EKG axis is essential for accurate cardiac diagnostics and significantly enhances a healthcare professional's ability to identify underlying heart conditions. Understanding the basics of EKG axis orientation and utilizing the right tools enables practitioners to effectively interpret the heart's electrical activity, ensuring that deviations are recognized and addressed promptly.
This guide outlines the fundamental concepts of EKG axis determination, including the significance of normal, left, and right axis deviations, along with critical steps for accurate axis calculation. The integration of advanced solutions like Neural Cloud Solutions' MaxYield™ platform streamlines this process, enabling more precise analysis and improved patient outcomes. Additionally, troubleshooting common issues enhances the reliability of EKG readings, ensuring healthcare providers maintain high standards of care.
Ultimately, the ability to accurately calculate and interpret the EKG axis is a vital skill in cardiology. By embracing the methodologies and tools discussed, healthcare professionals can improve their diagnostic capabilities and contribute to better patient management and treatment strategies. Engaging with continuous education and leveraging technology will empower practitioners to stay at the forefront of cardiac care.
Frequently Asked Questions
What does the EKG axis indicate?
The EKG axis indicates the general path of electrical activity in the heart as recorded by an electrocardiogram.
What is the normal range for EKG axis orientation?
The normal orientation for the EKG axis ranges from -30° to +90°.
How is the EKG axis established?
The EKG axis is established by examining the QRS complex in specific leads, mainly Lead I and Lead aVF, to evaluate the net electrical activity of the heart.
What is Left Axis Deviation (LAD)?
Left Axis Deviation (LAD) is when the EKG axis is less than -30°, often associated with conditions such as left ventricular hypertrophy or inferior myocardial infarction.
How common is LAD in patients with cardiac conditions?
In clinical settings, LAD is observed in approximately 20% of patients with significant cardiac conditions.
What is Right Axis Deviation (RAD)?
Right Axis Deviation (RAD) occurs when the EKG axis is greater than +90°, frequently seen in cases of right ventricular hypertrophy or pulmonary conditions.
How prevalent is RAD among patients with chronic lung disease?
Studies indicate that RAD can occur in up to 15% of patients with chronic lung disease.
What does Extreme Axis Deviation signify?
Extreme Axis Deviation ranges from -90° to +180° and may indicate severe underlying pathology.
Why is the EKG axis significant in cardiac diagnostics?
The EKG axis is a critical indicator of potential cardiac dysfunction and can highlight serious underlying issues that require further examination.
Can deviations in the EKG axis be life-threatening?
While deviations in the EKG axis may not be life-threatening on their own, they can indicate serious underlying issues that necessitate further assessment.
What role does MaxYield™ play in EKG analysis?
MaxYield™ enhances EKG analysis by automating the labeling process, improving efficiency, and accurately identifying ECG waves even in noisy recordings.
How does accurate interpretation of the EKG axis impact patient management?
Accurate interpretation of the EKG axis is essential for effective patient management, as it can indicate conditions such as pulmonary embolism or myocardial infarction based on axis deviation.


