Introduction
Understanding EKG Q waves is essential for accurate cardiac diagnosis. These initial negative shifts in the QRS complex can indicate significant underlying conditions, particularly myocardial infarction. This article explores the clinical implications of Q waves, providing insights into their identification and analysis. Additionally, we will discuss advanced tools available to enhance diagnostic confidence. The challenge remains: how can healthcare professionals effectively differentiate between normal and pathological Q waves to ensure timely and appropriate interventions?
Define Q Waves and Their Clinical Significance
represent the initial negative shift in the QRS complex of an electrocardiogram (ECG), marking the onset of ventricular depolarization. Their clinical importance is significant, as they can indicate various cardiac conditions, particularly myocardial infarction. Normal Q waves are typically small and narrow, whereas pathological Q waves exhibit increased width and depth, indicating underlying myocardial damage. A pathological Q deflection is defined as having a duration of 40 milliseconds or more, or a depth exceeding 25% of the height of the subsequent R deflection. This distinction regarding Q waves is crucial for accurate diagnosis and treatment planning.
Abnormal Q waves in individuals with myocardial infarction are noteworthy; research indicates that these waves are often observed in recordings corresponding to the affected coronary artery. For example, in cases of anterior myocardial infarction, Q deflections are commonly seen in leads V1-V4, indicating involvement of the Left Anterior Descending artery. Conversely, inferior myocardial infarction may exhibit Q patterns in leads II, III, and aVF, implicating the Right Coronary or Left Circumflex arteries.
Real-world examples underscore the importance of Q patterns in clinical practice. A study involving younger individuals found that unusual Q patterns were strong indicators of organic heart disease, even in the absence of myocardial infarction. This highlights the necessity for clinicians to interpret Q patterns within the broader context of the patient's clinical picture. As understanding of Q waves evolves, their role in diagnosing cardiac conditions remains a key focus in cardiology, emphasizing the need for accurate interpretation in ECG analysis.
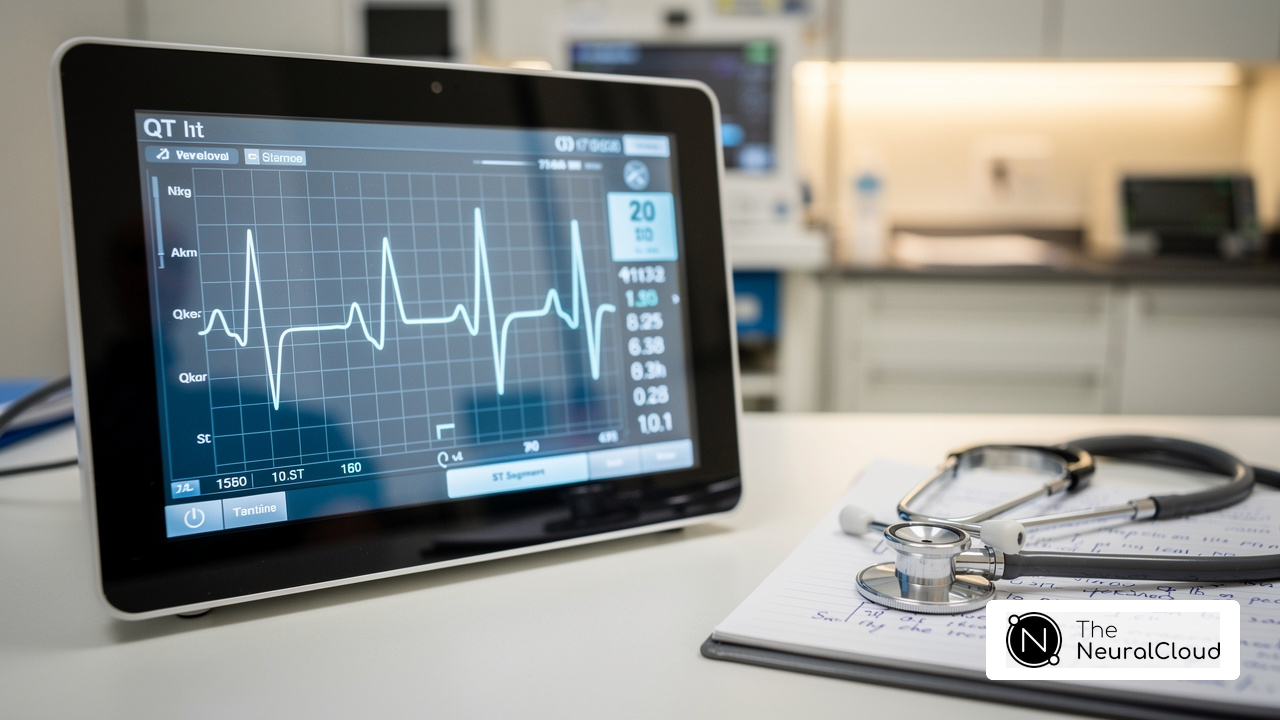
The platform from Neural Cloud Solutions significantly enhances the examination of Q signals through advanced noise filtering and automated labeling. This platform allows for the identification of Q waves, even in recordings with high levels of noise and artifacts, ensuring that critical data is not obscured. By incorporating this technology into your workflow, you can achieve a more efficient and precise analysis of Q patterns, ultimately improving patient outcomes.
Features of the platform:
- Advanced noise filtering
- Rapid isolation of Q signals
Advantages for Healthcare Professionals:
- Improved diagnostic accuracy
- Efficient workflow integration
In summary, the platform not only addresses the challenges in ECG analysis but also provides healthcare professionals with the tools needed for better patient outcomes.

Identify Q Waves Across Different ECG Leads
Recognizing EKG Q waves requires a systematic examination of ECG channels. In leads I, aVL, V5, and V6, Q waves are typically normal, indicating the left-to-right depolarization of the interventricular septum. Conversely, V1, V2, and V3 usually do not exhibit normal Q patterns; their presence may suggest underlying pathology. When assessing EKG Q waves, it is crucial to consider both their duration and depth; EKG Q waves are deemed abnormal if they exceed 0.04 seconds in duration or are deeper than 25% of the subsequent R pattern. Understanding these variations across leads is vital for accurate diagnosis.
The software from Neural Cloud Solutions offers advanced analysis and signal recognition capabilities that significantly enhance the accuracy of ECG interpretation. By swiftly isolating ECG signals from recordings affected by noise and artifacts, MaxYield™ ensures that variations across leads are recognized. This capability ultimately boosts diagnostic accuracy and efficiency for healthcare professionals.
Key Features of MaxYield™:
- Algorithms to improve signal clarity.
- Robust signal recognition to accurately identify EKG Q wave patterns.
- User-friendly interface for seamless integration into existing workflows.
Advantages for Healthcare Professionals:
- Support through reliable analysis.
- Increased efficiency in diagnostics, saving valuable time.
- Improved confidence in clinical decision-making based on precise data.
For practical application, users can refer to the guide on utilizing MaxYield™ for effective Q wave analysis.

Explore Pathological Q Waves and Their Implications
Q Waves are critical indicators of myocardial infarction, often revealing areas of necrotic tissue within the heart. These oscillations typically appear within hours after an infarction and can remain detectable indefinitely. Specifically, Q deflections noted in leads II, III, and aVF indicate inferior wall involvement, while those in leads V1 to V3 suggest anteroseptal damage. Recognizing Q Waves and other patterns is essential for clinicians, as they significantly influence treatment strategies and prognostic evaluations.
For instance, identifying Q Waves in individuals presenting with acute chest discomfort can prompt swift actions aimed at restoring blood circulation, thus enhancing outcomes for those affected. Recent studies emphasize that individuals with baseline Q deflections experience a 90% relative rise in the risk of death, shock, and congestive heart failure. This highlights the importance of early intervention. Furthermore, baseline Q Waves provide incremental value in predicting complications, especially during the interval between symptom onset and presentation.
As one specialist noted, "Reducing the duration from symptom onset to reperfusion should continue to be a significant treatment objective regardless of the presence or absence of Q patterns on the baseline ECG." This underscores the critical need for healthcare professionals to act swiftly upon identifying these abnormalities.
With the integration of Neural Cloud Solutions' technology, clinicians can utilize advanced algorithms and distinct signal recognition to enhance diagnostic accuracy. This ensures that critical patterns are accurately identified even in challenging conditions. The features of this technology streamline the analysis process and support timely clinical decision-making, ultimately enhancing outcomes for individuals.

Conduct Differential Diagnosis for Q Wave Abnormalities
Assessing abnormalities involves a comprehensive differential diagnosis that includes:
- myocardial infarction
- cardiomyopathies
- conduction irregularities
For example, a new deflection in a patient with chest pain often suggests an acute myocardial infarction, indicating the need for immediate intervention. Conversely, persistent Q waves in individuals with a known history of heart disease typically indicate a prior infarction. Additionally, conditions like left bundle branch block and hypertrophic cardiomyopathy can also show changes, complicating the diagnostic landscape.
A thorough clinical evaluation, which includes a detailed medical history and further diagnostic tests, is crucial for accurately identifying the underlying causes of Q wave abnormalities. Recent studies have shown that pathological Q waves, indicative of pathological Q patterns, occur in approximately 38.6% of cases, correlating with increased risks of heart failure hospitalization, reported at 1.7% within 30 days and 3.5% at one year. Furthermore, patients exhibiting pathological Q waves have a higher incidence of heart failure hospitalization (5.2% vs. 2.5%) compared to those without, emphasizing the importance of timely intervention in acute care settings.
Q waves are defined as those deeper than 2 mm, which is essential for understanding their clinical significance. The technology from Neural Cloud Solutions enhances this process by employing advanced algorithms and unique signal recognition. This technology allows for the rapid isolation of ECG signals, even in recordings with significant artifacts.
As one expert noted, 'The Q waves are an easily accessible and interpretable ECG metric that should be considered when determining the timing and mode of reperfusion strategy.' With the implementation of MaxYield™, the accuracy and efficiency of ECG analysis improve over time, effectively addressing the challenges posed by noise and signal artifacts.

Conclusion
EKG Q waves are vital indicators of cardiac health, especially in diagnosing conditions like myocardial infarction. Understanding the nuances of Q wave morphology, including the differences between normal and pathological Q waves, is crucial for accurate ECG interpretation. By examining Q waves across various ECG leads, healthcare professionals can uncover insights into potential myocardial damage, leading to informed clinical decisions.
The clinical significance of EKG Q waves cannot be overstated, as they play a key role in diagnosing myocardial infarction and other heart conditions. Abnormal Q waves can signal specific coronary artery involvement, which has direct implications for patient management. Furthermore, the integration of advanced tools like MaxYield™ significantly enhances the precision of Q wave analysis. This ensures that clinicians can effectively interpret complex ECG data, even in challenging scenarios.
Recognizing and accurately interpreting EKG Q waves is essential for improving patient outcomes. By staying updated on the clinical implications of Q wave abnormalities and leveraging advanced technologies, healthcare professionals can boost their diagnostic capabilities and respond swiftly to critical cardiac events. Embracing these insights and tools will lead to better management of heart conditions, ultimately saving lives.
Frequently Asked Questions
What are Q waves in an EKG?
Q waves are the initial negative shift in the QRS complex of an electrocardiogram (ECG), marking the onset of ventricular depolarization.
Why are Q waves clinically significant?
Q waves are clinically significant because they can indicate various cardiac conditions, particularly myocardial infarction (MI). Their characteristics, such as width and depth, help in diagnosing underlying myocardial damage.
What distinguishes normal Q waves from pathological Q waves?
Normal Q waves are typically small and narrow, while pathological Q waves exhibit increased width and depth. A pathological Q deflection is defined as having a duration of 40 milliseconds or more, or a depth exceeding 25% of the height of the subsequent R deflection.
How do Q waves relate to myocardial infarction?
Abnormal Q waves are often observed in individuals with myocardial infarction, and their presence can indicate the affected coronary artery. For instance, anterior MIs typically show Q deflections in leads V1-V4, while inferior MIs may exhibit Q patterns in leads II, III, and aVF.
What does research say about unusual Q patterns in younger individuals?
Research indicates that unusual Q patterns in younger individuals can be strong indicators of organic heart disease, even in the absence of myocardial infarction.
How does MaxYield™ enhance the examination of Q signals?
MaxYield™ from Neural Cloud Solutions enhances the examination of Q signals through advanced noise filtering and automated labeling, allowing for rapid isolation of ECG signals, even in recordings with high noise and artifacts.
What are the advantages of using MaxYield™ for healthcare professionals?
The advantages of using MaxYield™ include enhanced accuracy in ECG analysis, improved clinical decision-making, and efficient workflow integration.
What is the overall benefit of using MaxYield™ in ECG analysis?
MaxYield™ addresses challenges in ECG analysis and provides healthcare professionals with the tools needed for better patient outcomes by ensuring critical data is not obscured.
List of Sources
- Define Q Waves and Their Clinical Significance
- pmc.ncbi.nlm.nih.gov (https://pmc.ncbi.nlm.nih.gov/articles/PMC6932435)
- ecgwaves.com (https://ecgwaves.com/topic/ecg-criteria-myocardial-infarction-pathological-q-waves-r-waves)
- ecglectures.com (https://ecglectures.com/blog/the-anatomy-of-pathological-q-waves-on-ecg)
- statmodeling.stat.columbia.edu (https://statmodeling.stat.columbia.edu/2019/07/30/i-dont-have-a-clever-title-but-this-is-an-interesting-paper)
- hvt-journal.com (https://hvt-journal.com/articles/art557)
- Identify Q Waves Across Different ECG Leads
- ECG Learning Center - An introduction to clinical electrocardiography (https://ecg.utah.edu/lesson/3)
- litfl.com (https://litfl.com/q-wave-ecg-library)
- sciencedirect.com (https://sciencedirect.com/science/article/pii/S0196064424012502)
- ecgbook.com (https://ecgbook.com/pathological-q-wave)
- Explore Pathological Q Waves and Their Implications
- pubmed.ncbi.nlm.nih.gov (https://pubmed.ncbi.nlm.nih.gov/27744207)
- jacc.org (https://jacc.org/doi/10.1016/j.jacc.2009.01.046)
- pubmed.ncbi.nlm.nih.gov (https://pubmed.ncbi.nlm.nih.gov/23433932)
- pmc.ncbi.nlm.nih.gov (https://pmc.ncbi.nlm.nih.gov/articles/PMC12199798)
- litfl.com (https://litfl.com/q-wave-ecg-library)
- Conduct Differential Diagnosis for Q Wave Abnormalities
- litfl.com (https://litfl.com/q-wave-ecg-library)
- pmc.ncbi.nlm.nih.gov (https://pmc.ncbi.nlm.nih.gov/articles/PMC12199798)