Introduction
Understanding EKG strips is essential for healthcare professionals, as these visual representations of the heart's electrical activity are crucial for diagnosing various cardiac conditions. With nearly 200 million ECGs recorded annually, the ability to accurately interpret these strips can significantly impact patient care and outcomes. However, many practitioners encounter challenges with the intricacies of EKG analysis. This raises an important question: how can systematic techniques and advanced technology bridge this knowledge gap and enhance diagnostic accuracy? This article explores the fundamentals of EKG interpretation, offering insights into core components and practical strategies that empower clinicians to improve their skills and deliver high-quality cardiac care.
Explore the Basics of EKG Strips
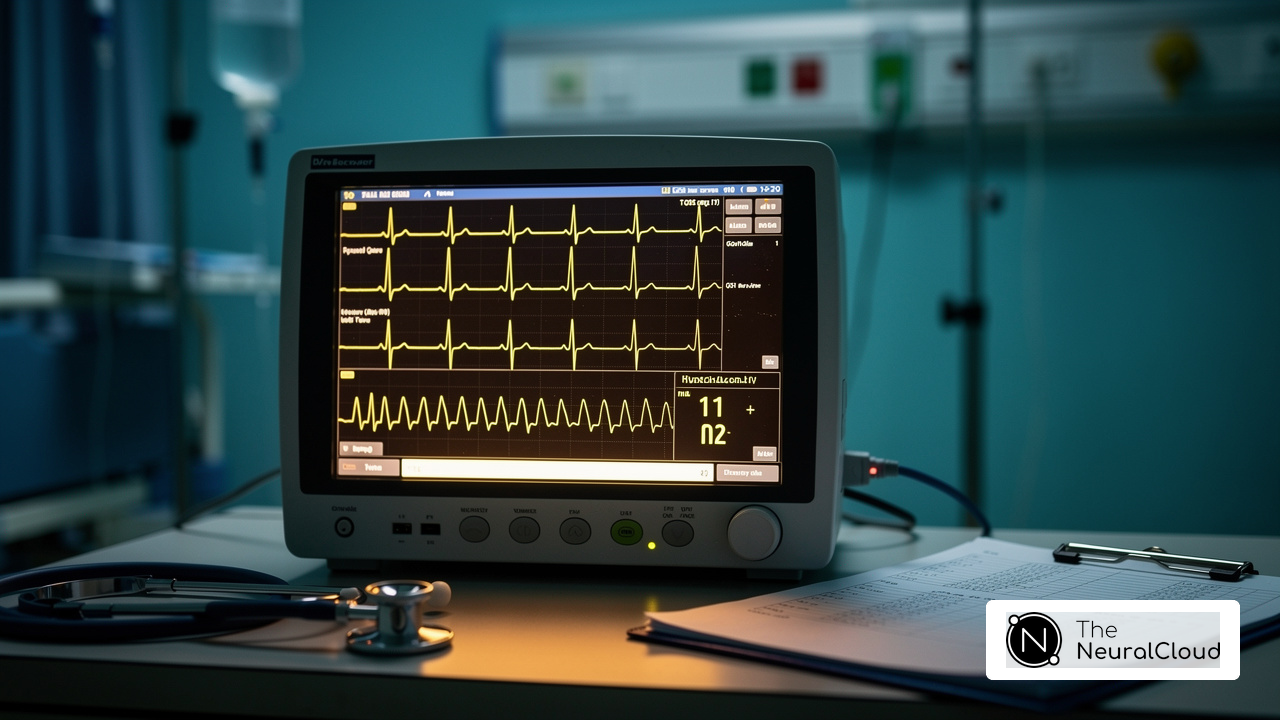
An ekg strip, or ECG strip, visually represents the heart's activity, divided into small squares where each small square corresponds to 0.04 seconds and each large square to 0.2 seconds. Mastery of this layout is crucial for interpreting heart rhythms and identifying abnormalities. The fundamental components of an EKG strip are the P-waves, QRS complexes, and T-waves, each of which signifies distinct phases of the cardiac cycle.
- P Wave: Represents atrial depolarization, indicating the electrical impulse that triggers heartbeats.
- QRS Complex: Signifies ventricular depolarization, reflecting the heart's main pumping action.
- T Wave: Denotes ventricular repolarization, marking the recovery phase of the heart's electrical cycle.
Understanding EKG strips is vital for healthcare professionals, as studies indicate that nearly 200 million ECGs are recorded annually worldwide, underscoring the widespread reliance on this diagnostic tool. However, a significant percentage of healthcare professionals report limited familiarity with the components of the EKG strip, which can hinder effective diagnosis and treatment.
Real-world examples illustrate the importance of EKG strip analysis within clinical settings. For instance, through EKG interpretation aids in managing conditions like atrial fibrillation, which can significantly influence patient outcomes. Cardiologists emphasize that a thorough understanding of the EKG strip is essential for accurate diagnosis, as it allows for timely interventions and improved diagnostic accuracy.
The MaxYield™ platform addresses these challenges by providing advanced analytical tools. This system offers real-time monitoring and can process 200,000 heartbeats in under 5 minutes. Utilizing machine learning, it effectively handles physiological variability and noise, ensuring clearer insights from ECG data. By mastering these basics, clinicians can establish a solid foundation for more complex interpretations, ultimately enhancing their ability to provide high-quality cardiac care.

Identify Key Components: P-Waves, QRS Complexes, and T-Waves
The components of the EKG strip are essential for diagnosis and treatment, particularly when leveraging advanced tools like Neural Cloud Solutions' technology.
- P-Wave: This small, rounded signal signifies atrial depolarization, occurring when the atria contract to propel blood into the ventricles. A normal P deflection is typically upright in most leads, indicating healthy atrial activity. With the software, clinicians can enhance their analysis, enhancing the accuracy of their analysis.
- The QRS Complex, which is a sequence of three forms (Q, R, and S), indicates ventricular depolarization and is typically the most noticeable characteristic observed on the EKG strip. It signifies the contraction of the ventricles, with a normal duration of less than 0.12 seconds. Abnormalities in the QRS Complex, such as widening, can indicate underlying heart disease. The technology enhances the analysis of the QRS Complex by rapidly isolating and labeling these critical features, even in recordings with high noise levels. This improvement supports clinicians in streamlining their workflows and improving diagnostic yield.
- T-Wave: Following the QRS Complex, the T-Wave marks the recovery phase of the ventricles. The T deflection is usually asymmetrical and should be upright in most leads. Deviations from the normal T wave morphology can signal issues such as ischemia or electrolyte imbalances. By incorporating MaxYield™, clinicians can streamline the analysis process, ensuring that T-wave abnormalities are quickly identified and addressed.
Understanding these components is crucial for interpreting the heart's electrical activity. For instance, real-life examples illustrate how clinicians utilize the EKG strip to diagnose arrhythmias. Cardiologists emphasize its significance in assessing ventricular function, stating that "the EKG strip is critical for identifying conduction abnormalities and potential arrhythmias." A precise understanding of the EKG strip components, aided by advanced noise filtering and analysis tools, is vital for prompt and efficient patient care.

Apply Systematic Techniques for EKG Interpretation
To effectively interpret an EKG strip, you should adhere to a systematic approach.
- First, determine if the rhythm is regular or irregular by measuring the distance between R-R intervals. This initial assessment is crucial for identifying potential arrhythmias. Automation in rhythm analysis provides real-time feedback to simplify this process.
- Next, calculate the heart rate by counting the R peaks in a 6-second EKG strip and multiplying that number by 10 to estimate the heart rate. This method offers a quick and reliable heart rate calculation, essential for evaluating patient stability. Tachycardia is defined as a heart rate exceeding 100 beats per minute, while bradycardia is characterized by a heart rate below 60 beats per minute. Advanced technology enhances this calculation with AI-driven algorithms that ensure accuracy and efficiency.
- Assess the P Waves: Check for the presence of P waves before each QRS complex. The presence of upright P waves indicates normal sinus rhythm, while absent or abnormal P waves may suggest atrial fibrillation or other arrhythmias. Automation in the system assists in quickly identifying these critical components.
- Measure the PR Interval: The PR interval should range from 0.12 to 0.20 seconds. A prolonged PR interval may indicate a delay in conduction through the atrioventricular (AV) node, which could necessitate further investigation. As noted by Yasar Sattar, MD, a basic understanding of cardiac anatomy and the significance of the PR interval is essential for accurate ECG interpretation. This tool offers insights that assist in clarifying these intervals.
- Finally, measure the duration and morphology of the QRS complex. A duration exceeding 0.12 seconds may suggest a bundle branch block or other conduction abnormalities, which are critical for diagnosis. The normal QRS segment duration is typically less than 0.12 seconds. With this system, technicians can conduct these analyses more quickly without sacrificing quality.
- Examine the T Waves: Look for abnormalities in the T wave, such as inversion or flattening, which may indicate ischemia or electrolyte imbalances. Recognizing these changes is vital for timely intervention. For instance, Torsades de Pointes is characterized by a heart rate between 150 to 300 beats per minute and requires immediate attention. This system identifies these abnormalities with advanced signal mapping.
By consistently applying these techniques, supported by automation and advanced analytics, practitioners can significantly improve diagnostic accuracy, leading to improved patient outcomes. Studies show that structured methods help reduce cognitive overload and improve diagnostic accuracy among practitioners. Understanding the differences in cognitive strategies between experts and novices can further aid in developing effective strategies for EKG interpretation.

Address Challenges: Noise Reduction and Signal Clarity in EKG Analysis
Noise reduction is essential for achieving accurate analysis of the EKG strip, as various factors can introduce interference. Common sources of noise include muscle artifacts, electrical interference, and inadequate electrode contact. To effectively address these challenges, consider the following strategies:
- Correct and secure electrode placement on the skin is crucial to minimize motion artifacts. Cleaning the skin with alcohol wipes helps eliminate oils and dirt that can affect signal quality.
- Use of Filtering Techniques: Employ techniques such as low-pass filters, notch filters, and wavelet transforms to eliminate baseline wander and high-frequency noise. These algorithms enhance readings by effectively isolating true cardiac signals from artifacts, significantly improving the quality of the EKG strip readings. The filtering platform excels in this area, utilizing technology that adjusts parameters based on noise characteristics, thereby suppressing noise without compromising the integrity of the cardiac signal. The platform's algorithms evolve with each use, continuously improving accuracy and efficiency.
- Routine calibration and maintenance of EKG machines are vital to prevent equipment-related noise, ensuring consistent performance and reliability in readings.
- Instructing patients to remain still during the EKG recording is important to reduce movement artifacts, which can distort the signal.
By implementing these strategies, healthcare professionals can markedly enhance the quality of EKG strip readings, leading to more accurate diagnoses and better patient outcomes. The effectiveness of filtering techniques, such as notch filters and wavelet transforms, has been shown to significantly improve the clarity in ECG recordings. Research has shown that the use of these filtering methods can result in a 30% enhancement in signal quality, emphasizing their significance in clinical practice. With MaxYield™, users can rapidly label P, QRS, and T Wave onsets and offsets, enabling a more efficient process that supports the discovery of new digital biomarkers.
Conclusion
Mastering EKG strip interpretation is essential for healthcare professionals aiming to provide accurate diagnoses and effective patient care. A thorough understanding of the key components—P waves, QRS complexes, and T waves—along with systematic techniques for analysis, empowers clinicians to identify cardiac conditions with confidence. By leveraging advanced tools like the MaxYield™ platform, practitioners can enhance their interpretation skills and streamline the diagnostic process, ultimately leading to improved patient outcomes.
The article highlights the importance of recognizing each component of the EKG strip and applying structured techniques for analysis. These methods, combined with noise reduction strategies and automated labeling, significantly enhance the clarity of EKG readings, allowing for quicker and more reliable assessments. The integration of technology into traditional practices not only aids in overcoming common challenges associated with EKG interpretation but also reinforces the necessity for ongoing education and skill development in this critical area of healthcare.
In conclusion, the ability to interpret EKG strips effectively is a vital skill for medical professionals. As the demand for precise cardiac diagnostics continues to grow, embracing systematic techniques and innovative solutions will be crucial. By prioritizing education and utilizing advanced analytical tools, healthcare providers can ensure they are equipped to deliver high-quality cardiac care, ultimately fostering better health outcomes for patients.
Frequently Asked Questions
What is an EKG strip?
An EKG strip, or ECG strip, is a visual representation of the heart's electrical activity, divided into small squares where each small square corresponds to 0.04 seconds and each large square to 0.2 seconds.
What are the main components of an EKG strip?
The main components of an EKG strip are the P wave, QRS complex, and T wave. The P wave represents atrial depolarization, the QRS complex signifies ventricular depolarization, and the T wave denotes ventricular repolarization.
Why is understanding EKG strips important for healthcare professionals?
Understanding EKG strips is vital for healthcare professionals as it enables them to interpret heart rhythms and identify abnormalities, which is crucial for effective diagnosis and treatment.
How many ECGs are recorded annually worldwide?
Nearly 200 million ECGs are recorded annually worldwide, highlighting the widespread reliance on this diagnostic tool.
What challenges do healthcare professionals face regarding EKG strip analysis?
A significant percentage of healthcare professionals report limited familiarity with the components of the EKG strip, which can hinder effective diagnosis and treatment.
How does accurate EKG strip analysis impact patient outcomes?
Accurate rhythm identification through EKG aids in managing conditions like atrial fibrillation, which can significantly influence patient outcomes.
What is the MaxYield™ platform?
The MaxYield™ platform is an advanced automated ECG analysis system that offers beat-by-beat analysis and can process 200,000 heartbeats in under 5 minutes, utilizing AI solutions to handle physiological variability and noise.
How can mastering the basics of EKG strips benefit clinicians?
By mastering the basics of EKG strips, clinicians can establish a solid foundation for more complex interpretations, ultimately enhancing their ability to provide high-quality cardiac care.
List of Sources
- Explore the Basics of EKG Strips
- mdpi.com (https://mdpi.com/2673-3846/2/4/39)
- Electrocardiography - Wikipedia (https://en.wikipedia.org/wiki/Electrocardiography)
- Accuracy of Physicians’ Electrocardiogram Interpretation (https://jamanetwork.com/journals/jamainternalmedicine/fullarticle/2771093)
- rch.org.au (https://rch.org.au/clinicalguide/guideline_index/Basic_Paediatric_ECG_interpretation)
- Identify Key Components: P-Waves, QRS Complexes, and T-Waves
- Normal Electrocardiography (ECG) Intervals: Normal Electrocardiography Intervals (https://emedicine.medscape.com/article/2172196-overview)
- Electrocardiography - Wikipedia (https://en.wikipedia.org/wiki/Electrocardiography)
- Electrocardiogram - StatPearls - NCBI Bookshelf (https://ncbi.nlm.nih.gov/books/NBK549803)
- Client Challenge (https://nature.com/articles/s41591-023-02396-3)
- AI-powered ECG model outperforms doctors in detecting hidden heart disease (https://news-medical.net/news/20250721/AI-powered-ECG-model-outperforms-doctors-in-detecting-hidden-heart-disease.aspx)
- Apply Systematic Techniques for EKG Interpretation
- Mastering EKG interpretation: 10 steps for accurate rhythm identification (https://ems1.com/ems-products/medical-monitoring/articles/ecg-interpretation-10-steps-for-rhythm-identification-HlbOvohuSltPKAL2)
- nurse.org (https://nurse.org/articles/how-to-read-an-ECG-or-EKG-electrocardiogram)
- litfl.com (https://litfl.com/developing-visual-expertise-in-ecg-interpretation)
- Electrocardiogram - StatPearls - NCBI Bookshelf (https://ncbi.nlm.nih.gov/books/NBK549803)
- Address Challenges: Noise Reduction and Signal Clarity in EKG Analysis
- psqh.com (https://psqh.com/analysis/cleaning-up-the-signal-to-noise-in-cardiac-monitoring)
- mobihealthnews.com (https://mobihealthnews.com/news/russian-entrepreneur-natalia-glazkova-talks-noise-canceling-ecg-software)
- Advancements in ECG Technology and Signal Processing (https://medicalsearch.com.au/buying-guide/advancements-in-ecg-technology-and-signal-processing/f/24927)
- morningstar.com (https://morningstar.com/news/accesswire/1034743msn/aiml-subsidiary-neural-cloud-signs-loi-with-circular-health-to-license-maxyieldtm-ecg-signal-processing)