Introduction
Understanding the R wave in electrocardiograms (ECGs) is crucial for accurate cardiac assessment. It serves as a key indicator of ventricular depolarization and overall heart health. However, challenges such as noise and misinterpretations can complicate ECG analysis. For health tech developers, mastering R wave analysis is essential. This expertise can lead to the creation of innovative tools that enhance diagnostic precision and improve patient outcomes.
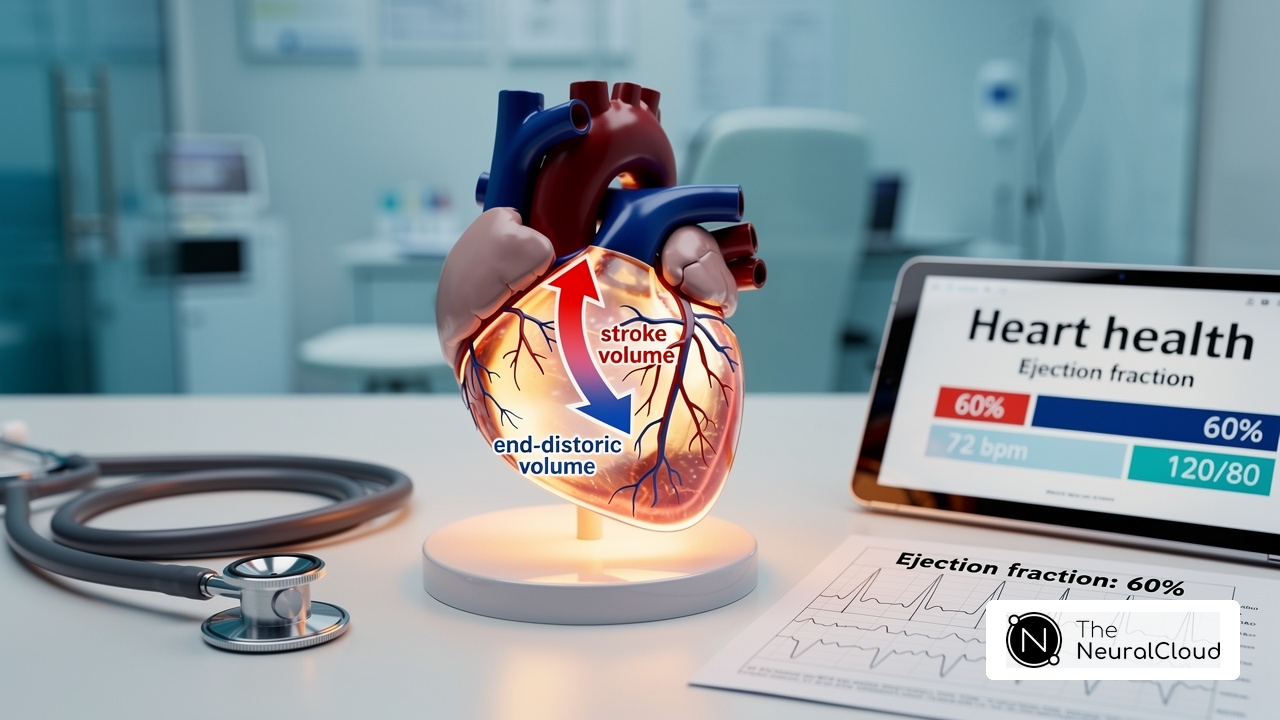
The MaxYield™ platform addresses these challenges head-on. It offers advanced algorithms designed to filter out noise and reduce misinterpretations, ensuring that ECG evaluations are reliable. By leveraging cutting-edge technology, MaxYield™ enhances the accuracy of R wave analysis, which is vital for effective cardiac assessment. This not only streamlines the diagnostic process but also supports healthcare professionals in making informed decisions.
The benefits of the MaxYield™ platform extend beyond just improved accuracy. With its user-friendly interface, healthcare professionals can easily integrate the platform into their existing workflows. This seamless integration allows for quicker diagnoses and better patient management. Ultimately, the MaxYield™ platform empowers healthcare providers to deliver higher-quality care, leading to improved patient outcomes.
Define the R Wave: Importance in ECG Interpretation
The R Wave represents the initial upward shift within the QRS complex of an electrocardiogram (ECG), marking the early phase of ventricular depolarization. It is crucial, as it reflects the heart's electrical activity during contraction. Abnormalities, such as increased amplitudes and late R transition, can indicate underlying health issues. For example, studies have shown that increased R amplitudes often correlate with heart muscle hypertrophy, commonly seen in individuals with hypertension or chronic heart disease.
Moreover, late R transition is linked to significant coronary artery disease, particularly involving the left anterior descending artery. This association necessitates immediate evaluation due to its connection to the risk of sudden cardiac death. Recent research highlights that the occurrence of poor R progression (PRWP) ranges from 15% to 42%, with misinterpretations potentially leading to unnecessary testing and increased healthcare costs.
For health tech developers, advanced ECG analysis tools are essential. These tools empower healthcare professionals to effectively diagnose and manage cardiac diseases, ultimately enhancing patient outcomes. The MaxYield™ platform offers advanced data processing and signal recognition capabilities, significantly improving ECG analysis efficiency.
With MaxYield™, developers can analyze ECGs in under 5 minutes, ensuring that the R Wave component and other critical features are accurately identified and assessed. This capability aids in better clinical decision-making, providing healthcare professionals with the tools they need to improve patient care.

Analyze R Wave Characteristics: Normal vs. Abnormal Configurations
Normal R progression shows an increase in amplitude from leads V1 to V6, reflecting the electrical activity transition across the ventricles. However, abnormal configurations, like PRWP or elevated R wave EKG readings in V1, can indicate various conditions, including myocardial infarction and right bundle branch block. Recent studies reveal that PRWP occurs in about 1.8% of the general population, with a positive predictive value for CAD of only 7.3%. This suggests that PRWP may often result from lead misplacement rather than true cardiac pathology.
This situation underscores the critical need for accurate ECG interpretation, as studies indicate that up to 10.8% of ECGs may show misplacement, which can lead to misdiagnosis due to incorrect R wave EKG results. Developers should prioritize these characteristics when designing algorithms for ECG analysis, ensuring their tools can effectively identify deviations from normal patterns. By integrating advanced technologies, such as those in Neural Cloud Solutions' platform, which excels in machine learning applications, developers can significantly enhance diagnostic accuracy.
This system efficiently extracts features affected by noise and artifacts, addressing issues caused by physiological variability and improving clinical outcomes. The MaxYield™ platform stands out by offering features that enhance data interpretation, providing healthcare professionals with reliable tools to interpret complex data accurately.

Utilize Technology for Enhanced R Wave Analysis: Integrating Advanced ECG Solutions
ECG analysis faces several challenges, including the need for precision and speed in interpretation. Advanced technologies like AI can significantly enhance this process. The solution from Neural Cloud Solutions automates the labeling of ECG waveforms, such as the P, QRS, T waves, and R wave EKG, which increases accuracy and improves efficiency.
Features of MaxYield™:
- Automatic Labeling: The platform automatically labels ECG waveforms, reducing manual effort and potential errors.
- Noise Reduction: It employs advanced algorithms, ensuring reliable evaluations even in noisy environments.
- Real-Time Detection: Features like real-time monitoring enhance workflow efficiency for healthcare professionals.
- Cloud Processing: Leveraging cloud technology allows for the processing of large datasets in CSV format, promoting continuous learning and refinement of diagnostic algorithms.
The advantages of using MaxYield™ are substantial. The AI ECG model has achieved a 75.2% accuracy rate, a significant improvement over the 41.8% rate seen with standard triage methods. This underscores the importance of accurate diagnostics, empowering healthcare professionals to make informed decisions based on accurate cardiac insights. As noted by Timothy D. Henry, MD, AI can shorten treatment times, highlighting the critical role of AI in improving clinical outcomes.
However, it is crucial to remain aware of the skepticism surrounding AI reliance in clinical practice. Technology should complement human judgment rather than replace it, ensuring that healthcare professionals can confidently utilize these advancements in their work.
Overcome Challenges in R Wave Interpretation: Addressing Noise and Artifacts
pose significant challenges in interpreting ECG signals, often resulting in misdiagnosis or missed detections. Common sources of noise include:
- Muscle movements
- Electrical interference
- Improper lead placement
To address these issues, developers can utilize technology such as:
These techniques enhance signal quality and clarity.
The algorithm stands out by effectively identifying and labeling critical data, even amidst high levels of noise. Its innovative algorithm quickly isolates ECG signals from recordings affected by baseline wander, movement, and muscle artifacts, revealing previously hidden sections of lengthy Holter, 1-Lead, and patch monitor recordings. This adaptability allows the algorithm to evolve with each use, continuously improving its accuracy and efficiency.
For example, the system has shown an impressive average sensitivity of 99.42% at a signal-to-noise ratio of -12 dB, highlighting the effectiveness of advanced methodologies in noisy environments. Recent advancements, including the integration of machine learning within MaxYield™, enable systems to learn and differentiate between authentic R wave EKG signals and interference, thereby enhancing the reliability of EKG evaluations.
Additionally, methods like the WLNH method and the comparison of Variational Mode Decomposition (VMD) with MRA Wavelet decompositions demonstrate practical applications of these techniques. The incorporation of ECG tracking in devices facilitates real-time monitoring, significantly improving the overall efficiency of ECG assessment tools.
By tackling these challenges with cutting-edge methodologies, including the adaptive algorithm of MaxYield™, developers can create robust solutions that provide accurate and actionable insights for healthcare professionals.

Conclusion
Mastering the analysis of the R wave in EKG is crucial for health tech developers aiming to enhance cardiac care. The R wave serves as a key indicator of ventricular depolarization, and its variations can signal important cardiac conditions. Understanding its significance allows developers to create more precise and effective ECG evaluation tools, ultimately improving patient outcomes.
However, ECG analysis faces challenges, particularly with noise and artifacts that can obscure readings. The MaxYield™ platform addresses these issues by integrating sophisticated algorithms and machine learning. These features enhance diagnostic accuracy, allowing for clearer interpretations of the R wave and other critical components of the ECG. As a result, healthcare professionals can make better clinical decisions based on reliable data.
The advantages of using the MaxYield™ platform are significant. By improving the accuracy of ECG evaluations, it not only aids in identifying normal and abnormal R wave configurations but also enhances overall patient safety. Developers are encouraged to leverage these insights and tools to create innovative solutions that address the challenges of noise and misinterpretation. This integration of advanced technology in R wave analysis is essential for the evolving healthcare landscape.
In conclusion, the path toward improved cardiac care is clearer than ever. By utilizing the MaxYield™ platform, developers can enhance the reliability of ECG evaluations, ultimately benefiting both healthcare professionals and patients alike. The commitment to overcoming the challenges in ECG analysis will lead to better outcomes and a safer healthcare environment.
Frequently Asked Questions
What does the R wave in an ECG represent?
The R wave represents the initial upward shift within the QRS complex of an electrocardiogram (ECG), marking the early phase of ventricular depolarization.
Why is analyzing the R wave important in ECG interpretation?
Analyzing the R wave is vital because it reflects the heart's electrical activity during contraction and variations in its amplitude and morphology can indicate various cardiac conditions.
What cardiac conditions can variations in the R wave indicate?
Variations in the R wave can indicate conditions such as left ventricular hypertrophy and myocardial infarction.
How is increased R wave amplitude related to heart conditions?
Increased R amplitudes often correlate with heart muscle hypertrophy, commonly seen in individuals with hypertension or chronic heart disease.
What does late R transition signify?
Late R transition is linked to significant coronary artery disease, particularly involving the left anterior descending artery, and requires immediate evaluation due to its association with the risk of sudden cardiac death.
What is the range of poor R wave progression (PRWP) in studies?
The occurrence of poor R wave progression (PRWP) ranges from 15% to 42%.
What are the implications of misinterpreting the R wave?
Misinterpretations of the R wave can lead to unnecessary testing and increased healthcare costs.
How can health tech developers improve ECG evaluation tools?
Health tech developers can enhance ECG evaluation tools by understanding the significance of the R peak in the R wave EKG, which helps in accurate diagnosis and management of cardiac diseases.
What features does the MaxYield™ platform offer for ECG analysis?
The MaxYield™ platform offers advanced noise filtering and signal recognition capabilities, significantly improving the efficiency of ECG analysis.
How quickly can the MaxYield™ platform analyze heartbeats?
The MaxYield™ platform can analyze 200,000 heartbeats in under 5 minutes, ensuring accurate identification and assessment of the R wave EKG and other critical features.
List of Sources
- Define the R Wave: Importance in ECG Interpretation
- gehealthcare.com (https://gehealthcare.com/insights/article/the-costs-of-ecg-misdiagnosis-due-to-poor-rwave-progression?srsltid=AfmBOooDi_7_qGpKCjD0zEi7p0mg9MLuDXRng3LewHl4Hs9ugI-JXEhi)
- healio.com (https://healio.com/cardiology/learn-the-heart/ecg-review/ecg-interpretation-tutorial/r-wave)
- droracle.ai (https://droracle.ai/articles/213666/what-is-the-significance-of-a-new-late-r)
- sunfox.in (https://sunfox.in/blogs/understanding-the-r-wave-ecg?srsltid=AfmBOopY5yNGca8nsV06Ulev3VtAZZUuUYrLhM_MlUCNSYBiih7xOG58)
- mdpi.com (https://mdpi.com/2076-3417/14/21/10078)
- Analyze R Wave Characteristics: Normal vs. Abnormal Configurations
- sciencedirect.com (https://sciencedirect.com/science/article/abs/pii/S0022073680800446)
- gehealthcare.com (https://gehealthcare.com/insights/article/the-costs-of-ecg-misdiagnosis-due-to-poor-rwave-progression?srsltid=AfmBOor4J3PnjSYopt0cNr24j9l4Gs-0qNT-u1yGo67y8Uhz7qtBxtWm)
- tandfonline.com (https://tandfonline.com/doi/full/10.3109/07853890903555334)
- pmc.ncbi.nlm.nih.gov (https://pmc.ncbi.nlm.nih.gov/articles/PMC2771797)
- Utilize Technology for Enhanced R Wave Analysis: Integrating Advanced ECG Solutions
- news-medical.net (https://news-medical.net/news/20251029/AI-driven-ECG-improves-detection-of-severe-heart-attacks.aspx)
- innovationsincrm.com (https://innovationsincrm.com/latest-news/1255-validation-of-ai-enabled-automatic-screening-technology-for-af)
- | tctmd.com (https://tctmd.com/news/year-review-evidence-around-ai-cardiology-grows)
- Current and Future Use of Artificial Intelligence in Electrocardiography - PMC (https://pmc.ncbi.nlm.nih.gov/articles/PMC10145690)
- cureus.com (https://cureus.com/articles/405923-the-use-of-artificial-intelligence-in-ecg-interpretation-in-the-outpatient-setting-a-scoping-review)
- Overcome Challenges in R Wave Interpretation: Addressing Noise and Artifacts
- diagnosticimaging.com (https://diagnosticimaging.com/view/fda-new-electrocardiogram-suite-algorithms-and-analytics)
- The latest innovations in ECG technology and analysis - Norav Medical (https://noravmedical.com/advancements-in-ecg-technology-exploring-the-latest-innovations-in-ecg-analysis)
- iieta.org (https://iieta.org/journals/mmep/paper/10.18280/mmep.110812)
- pmc.ncbi.nlm.nih.gov (https://pmc.ncbi.nlm.nih.gov/articles/PMC7357458)