Introduction
Understanding the nuances of T wave morphology is crucial for accurate ECG interpretation. These deflections offer vital insights into cardiac health, making their analysis essential. Elevated T waves, in particular, can indicate significant health issues such as hyperkalemia and ischemia. Recognizing these abnormalities is key; when overlooked, they can lead to serious complications.
Advanced technologies play a pivotal role in enhancing the diagnostic process. By improving the accuracy of ECG analysis, healthcare professionals can better identify T wave abnormalities. This not only aids in timely intervention but also helps in preventing potential health crises. The integration of innovative tools into ECG interpretation can significantly elevate patient care.
Clarify Normal T Wave Characteristics
Normal T deflections typically represent positive movements following the QRS complex on an ECG, indicating ventricular repolarization. Understanding the key characteristics:
- Upright in Most Leads: T waves are upright in all leads except aVR and V1, where inversions may occur without clinical significance.
- Amplitude: The amplitude of T waves is generally less than 5 mm in limb leads and less than 10 mm in precordial leads. Values exceeding 10 mm in men and 8 mm in women are considered abnormal.
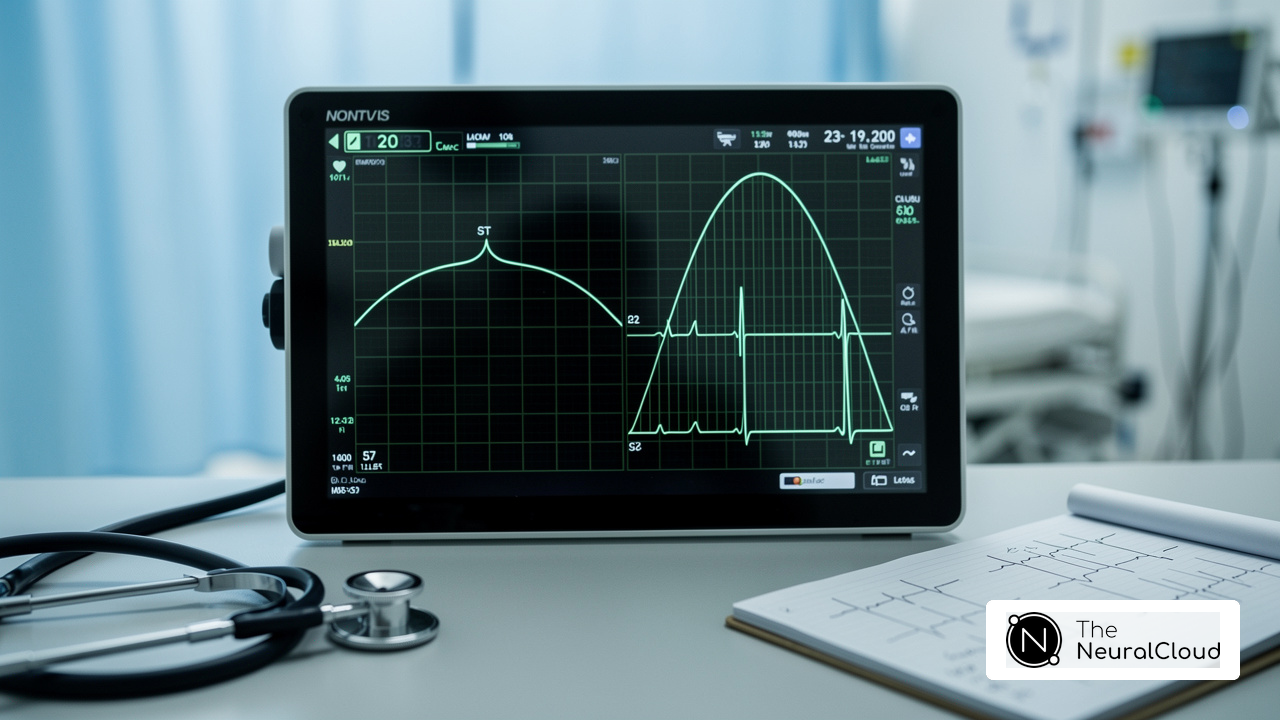
- Shape: Normal T wave forms are smooth and rounded, displaying a slight asymmetry characterized by a steeper downslope compared to the upslope.
- Duration: The duration of the T wave should not exceed 0.5 seconds.
Recognizing these characteristics is crucial, as deviations can indicate underlying cardiac issues. For example, elevated T waves may suggest ischemia, while flattened T waves or other pathologies. Clinicians emphasize the importance of these characteristics in identifying conditions like myocardial ischemia and hypertensive disorders, highlighting the necessity for accurate T wave assessment in clinical practice.
The technology integrated with wearable technology addresses the challenges in ECG analysis by automating labeling and minimizing noise. This enhancement improves the efficiency of ECG interpretation, allowing clinicians to make informed decisions based on precise data. By streamlining the process, healthcare professionals can focus more on patient care, ultimately leading to better outcomes.

Explore Abnormal T Wave Presentations
Abnormal T wave presentations can manifest in various forms, each carrying distinct clinical implications:
- Tall, Peaked: These sharp and pointed waves often indicate hyperkalemia, a condition characterized by elevated potassium levels. The peaked T signal is recognized as the earliest and most reversible indication of hyperkalemia, which reflects the elevated T wave meaning due to enhanced potassium conductance that accelerates repolarization. This abnormality is critical for early detection, as it can prevent life-threatening arrhythmias.
- Inverted T Waves: Usually indicative of ischemia or other cardiac issues, inverted T waves may appear in sections where T waves are generally upright. Their presence can signal underlying heart diseases such as hypertrophic cardiomyopathy or arrhythmogenic right ventricular cardiomyopathy (ARVC). Notably, the occurrence of inverted T patterns in right precordial leads is approximately 0.5% in the middle-aged population, with a favorable prognosis similar to the general population.
- Biphasic T Waves: Characterized by two peaks, biphasic T waves can suggest underlying cardiac issues or electrolyte imbalances. Their identification is essential for understanding the patient's cardiac health.
- Flat T Waves: These may indicate ischemia or electrolyte disturbances, such as hypokalemia. Identifying flat T patterns can prompt further examination into possible underlying conditions.
Utilizing advanced technologies is crucial for ECG analysis. For instance, in urgent situations, advanced technologies can enhance the ability to diagnose by swiftly recognizing T abnormalities, thus enabling quicker clinical interventions. Experts emphasize that accurate identification of these changes is vital, as they often serve as reliable predictors of patient outcomes, surpassing even serum potassium levels in significance.

Analyze Clinical Implications of Elevated T Waves
Elevated T waves can indicate various underlying health issues, including:
- Hyperkalemia: Elevated potassium levels often lead to tall, peaked T waves, which are critical indicators of potential cardiac events. In severe instances, the QRS complex may widen, and T waves can merge with the QRS, creating a classic 'sine-pattern', a medical emergency requiring urgent attention. The technology enhances the identification of these critical patterns through advanced noise filtering and analysis. This ensures that even in noisy recordings, significant changes are accurately detected, ultimately contributing to improved patient care by minimizing the need for repeat tests.
In the context of Acute Myocardial Infarction (AMI), the significance of T wave changes is highlighted by clinical studies, which are particularly significant in the early stages of myocardial infarction, showing increased height and symmetry compared to normal T deflections. These changes can double the sensitivity for detecting occlusive myocardial infarction and facilitate a diagnosis up to three hours faster, underscoring the need for prompt medical intervention. Notably, up to 40% of complete occlusive AMIs were missed when using the presence of STEMI on ECG alone as the main decision point for PCI, highlighting the diagnostic challenges faced in clinical practice. The MaxYield™ system aids in this process by rapidly analyzing and isolating key features in ECG signals, allowing for quicker and more precise clinical decisions, which can also lead to reduced operational costs.
- Pericarditis: Inflammation of the pericardium can also present as ST segment elevation, which is associated with chest pain, indicating the need for further evaluation and management. The capacity of the MaxYield™ system to deliver detailed insights into ECG recordings can aid clinicians in making informed decisions, improving workflow efficiency and minimizing unnecessary procedures.
- Heart failure: This condition may present with T wave signal irregularities, indicating increased cardiac workload and potential heart failure risk. MaxYield™ supports the identification of these abnormalities through its comprehensive beat-by-beat analysis, enhancing the clinician's ability to assess patient risk effectively while optimizing resource allocation.
Grasping these implications is essential for clinicians, as prompt identification of the underlying conditions can greatly influence patient outcomes. For instance, cardiologists emphasize that early detection can lead to accurate identification of hyperacute T waves, which in turn can enable immediate reperfusion therapies, optimizing survival rates in acute coronary occlusion scenarios. Dr. Hana Hybasek Dzurikova noted that while definitive diagnosis of hyperkalemia requires blood tests, Neural Cloud Solutions' capability to discern key ECG patterns supports clinicians in distinguishing between acute coronary events and other conditions. By leveraging advanced ECG analysis tools, including its integration with wearable technology, healthcare providers can enhance their diagnostic capabilities and prioritize interventions based on these critical ECG findings.

Utilize Advanced Technologies for Enhanced ECG Analysis
The integration of advanced technologies into ECG analysis has transformed the field, significantly enhancing diagnostic capabilities. However, challenges remain in accurately interpreting ECG data, which can lead to misdiagnoses and delayed treatments. To address these issues, the analysis incorporates several key technologies that improve ECG analysis:
- Algorithms: These algorithms quickly analyze ECG data, identifying patterns and abnormalities that may be missed by human interpretation. For example, AI models have achieved an impressive accuracy of 95.4% in classifying ECG signals, demonstrating their potential to surpass traditional methods.
- Learning models: Continuous learning models adapt and enhance their performance over time, resulting in improved accuracy and efficiency. Research shows that machine learning can reduce false-positive results by up to 98%, streamlining clinical workflows and minimizing unnecessary interventions.
- Automation platforms: Platforms like Neural Cloud Solutions' system automate the labeling of ECG waveforms, including P, QRS, and T wave onsets and offsets. This automation not only speeds up the analysis process but also enhances the quality of ECG data, allowing healthcare providers to identify cardiac events with greater confidence. Additionally, the system utilizes advanced algorithms that improve signal clarity, further supporting accurate diagnoses.
- Monitoring devices: These devices continuously monitor heart activity, providing real-time data that can be analyzed for immediate clinical insights. The integration of AI in wearable technology has shown strong correlations with manual assessments, improving the detection of arrhythmias and other cardiac conditions.
By leveraging these technologies, particularly the advanced features of MaxYield™, healthcare professionals can significantly enhance their diagnostic capabilities. This leads to better patient outcomes, ensuring that patients receive timely and effective care.

Conclusion
Understanding elevated T waves in ECG analysis is crucial for accurate cardiac assessments. The nuances of T wave morphology, including their normal characteristics and potential abnormalities, are essential for identifying underlying health issues. Recognizing these patterns aids in diagnosing conditions like hyperkalemia and myocardial ischemia, enhancing the overall efficacy of clinical decision-making.
However, ECG analysis presents challenges that can complicate diagnosis. Normal T waves are typically upright and smoothly shaped, while deviations can indicate serious cardiac conditions. This is where the MaxYield™ platform comes into play. It integrates advanced technologies, such as AI and machine learning, into ECG analysis, empowering healthcare professionals to detect changes with greater precision.
Features of the MaxYield™ Platform:
- AI-Driven Analysis: Enhances accuracy in identifying T wave abnormalities.
- User-Friendly Interface: Streamlines workflow for healthcare professionals.
- Real-Time Data Processing: Facilitates timely interventions for improved patient outcomes.
By leveraging these features, clinicians can significantly enhance their diagnostic capabilities. The platform not only improves ECG analysis but also prioritizes patient health through timely and accurate diagnoses. In a landscape where rapid and precise diagnosis can greatly impact patient care, embracing innovations like MaxYield™ is essential for effective healthcare delivery.
Frequently Asked Questions
What do normal T wave deflections represent on an ECG?
Normal T wave deflections represent positive movements following the QRS complex on an ECG, indicating ventricular repolarization.
What are the key characteristics of normal T waves?
The key characteristics of normal T waves include being upright in most leads (except aVR and V1), having an amplitude of less than 5 mm in limb leads and less than 10 mm in precordial leads, being smooth and rounded in shape with a steeper downslope compared to the upslope, and having a duration that does not exceed 0.5 seconds.
What does it mean if T waves are inverted in certain leads?
Inversions of T waves in leads aVR and V1 may occur without clinical significance, but T-wave inversions in contiguous leads may suggest ischemia.
What amplitude values are considered abnormal for T waves?
Amplitude values exceeding 10 mm in men and 8 mm in women are considered abnormal.
Why is it important to assess T wave characteristics?
Assessing T wave characteristics is crucial because deviations can indicate underlying cardiac issues, such as ischemia or electrolyte imbalances.
How does the MaxYield™ platform improve ECG analysis?
The MaxYield™ platform improves ECG analysis by automating labeling and minimizing noise, which enhances the efficiency of ECG assessments and allows clinicians to make informed decisions based on precise T evaluations.
List of Sources
- Clarify Normal T Wave Characteristics
- The T-wave: physiology, variants and ECG features – (https://ecgwaves.com/the-t-wave-physiology-variants-and-ecg-features)
- ECG T Wave Inversion Features Predict Cardiomyopathy | www.PhysiciansWeekly.com (https://physiciansweekly.com/post/ecg-t-wave-inversion-features-predict-cardiomyopathy)
- T wave (https://litfl.com/t-wave-ecg-library)
- Explore Abnormal T Wave Presentations
- tctmd.com (https://tctmd.com/news/ecg-abnormalities-routine-screening-tied-cvd-events-large-study)
- ahajournals.org (https://ahajournals.org/doi/10.1161/circulationaha.112.098681)
- Why T Waves Peak in Hyperkalemia (https://ecglectures.com/blog/peaked-t-waves-in-hyperkalemia)
- Unmasking Hyperkalemia: Highlighting Critical ECG Changes (https://powerfulmedical.com/blog/hyperkalemia-ecg-critical-changes)
- Analyze Clinical Implications of Elevated T Waves
- Electrocardiographic Abnormalities in Patients with Hyperkalemia: A Retrospective Study in an Emergency Department in Colombia - PMC (https://pmc.ncbi.nlm.nih.gov/articles/PMC11215665)
- Impending Danger: Evolution of Hyperacute T Waves to Cardiac Arrest (https://cureus.com/articles/432103-impending-danger-evolution-of-hyperacute-t-waves-to-cardiac-arrest)
- powerfulmedical.com (https://powerfulmedical.com/blog/hyperacute-t-waves)
- docwirenews.com (https://docwirenews.com/post/mortality-risk-after-acute-severe-hyperkalemia)
- Unmasking Hyperkalemia: Highlighting Critical ECG Changes (https://powerfulmedical.com/blog/hyperkalemia-ecg-critical-changes)
- Utilize Advanced Technologies for Enhanced ECG Analysis
- New study finds AI model improves heart attack detection (https://health.ucdavis.edu/news/headlines/new-study-finds-ai-model-improves-heart-attack-detection/2025/11)
- Checking your browser - reCAPTCHA (https://pmc.ncbi.nlm.nih.gov/articles/PMC12419789)
- PMcardio Reports Positive RCT Results and Late-Breaking Clinical Science for STEMI Detection (https://powerfulmedical.com/blog/pmcardio-reports-positive-rct-results-and-late-breaking-clinical-science-for-stemi-detection)
- Current and Future Use of Artificial Intelligence in Electrocardiography - PMC (https://pmc.ncbi.nlm.nih.gov/articles/PMC10145690)
- pmc.ncbi.nlm.nih.gov (https://pmc.ncbi.nlm.nih.gov/articles/PMC11988324)