Introduction
Understanding the intricacies of ECG waves is essential for accurate cardiac assessment. However, many healthcare professionals face challenges in interpreting ECGs. This article presents a comprehensive checklist that clarifies the key components of ECG waves:
- P-waves
- QRS complexes
- T-waves
While emphasizing the importance of identifying both normal and abnormal patterns. Ensuring that critical abnormalities are not overlooked in a fast-paced clinical environment is vital. Explore the systematic steps and advanced tools that can enhance ECG analysis and ultimately improve patient outcomes.
Identify Key ECG Components: P-Wave, QRS Complex, and T-Wave
The P-Wave, with a normal duration of less than 0.11 seconds and an amplitude not exceeding 3 mm. Abnormalities, such as increased duration or specific morphologies, can indicate conditions like atrial enlargement, which is crucial for diagnosing atrial fibrillation and other cardiac issues. With the right tools, these characteristics can be automatically labeled and analyzed, allowing for improved accuracy, thereby enhancing patient care.
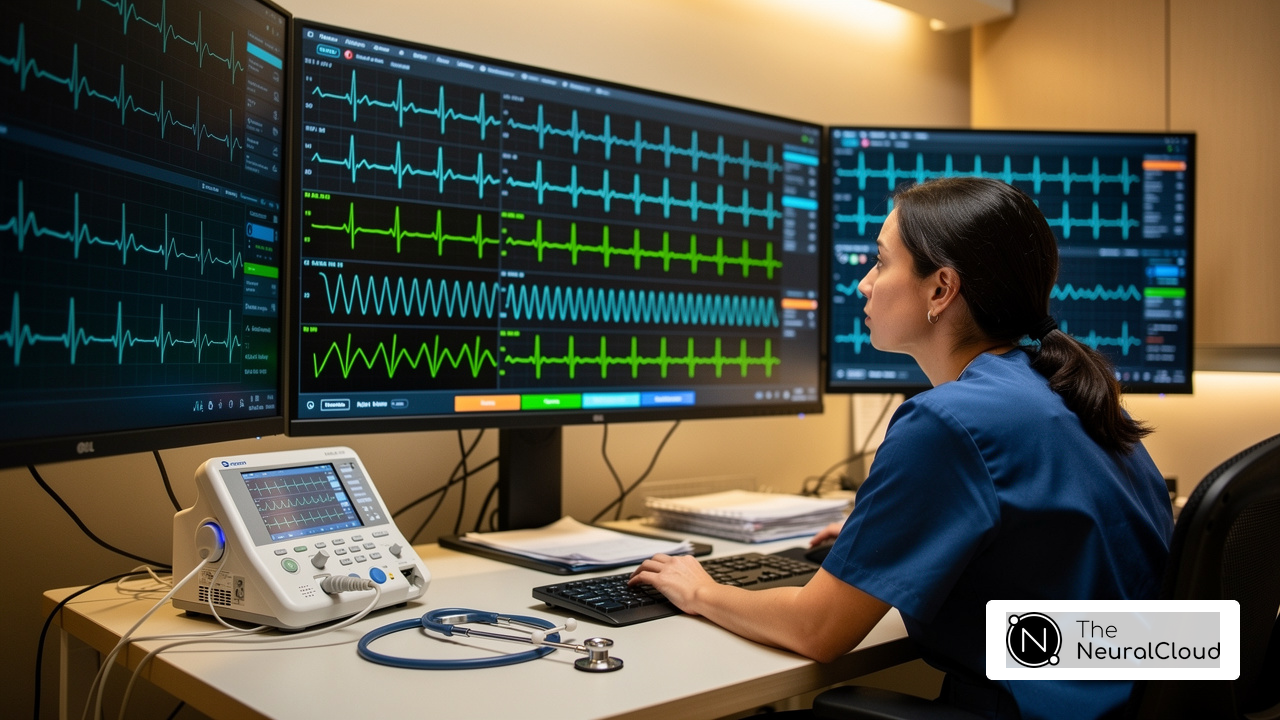
The QRS Complex represents ventricular depolarization, with a normal duration ranging from 0.06 to 0.10 seconds. Its morphology is vital for assessing cardiac health; variations can indicate underlying pathologies, such as myocardial infarction or conduction abnormalities. The MaxYield™ system provides beat-by-beat assessment, enabling healthcare professionals to examine QRS morphology with both accuracy and rapidity, ultimately supporting better patient outcomes.
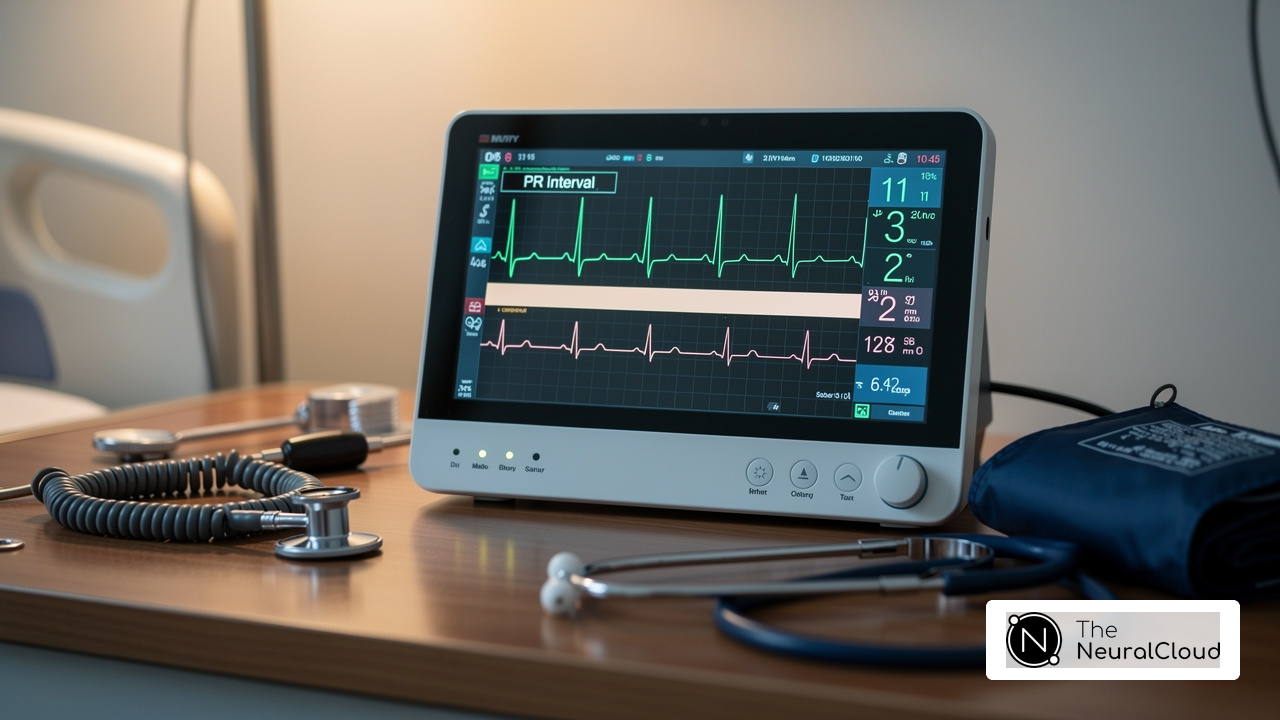
The T-Wave reflects ventricular repolarization, characterized by an asymmetrical shape and a height that should not exceed 5 mm. Abnormalities, such as inversion or flattening, can signal ischemia or other cardiac conditions. This system facilitates thorough ECG evaluation by converting noisy recordings into clear insights, enabling better analysis and enhancing clinical decision-making.
It is crucial to document each ECG component's characteristics and comparison in the context of ECG waves explained. This practice aids in tracking changes over time and supports clinical decision-making. With the right documentation tools, precise documentation is streamlined, facilitating communication among healthcare professionals regarding patient status and treatment plans.

Differentiate Normal and Abnormal ECG Patterns
Normal Sinus Rhythm: Confirm the presence of a consistent rhythm characterized by a heart rate of 60-100 bpm, regular intervals, and identifiable components, which are further described in the ECG analysis, including the P-wave, QRS complex, and T-wave. This rhythm is essential for evaluating overall cardiac health. The incorporation of technology automates the identification of these components, enhancing efficiency in ECG analysis and recovering previously obscured data.
Atrial Fibrillation: Look for an irregularly irregular rhythm with no discernible P-waves, indicating chaotic atrial activity. Atrial Fibrillation is associated with a significant increase in stroke risk, estimated at 4 to 5 times higher than normal. This highlights the need for accurate identification as outlined in the guidelines. The advanced features of this technology assist in isolating these irregularities, even in recordings with significant artifacts, ensuring accurate diagnosis.
Tachycardia: Identify rhythms occurring at a rapid rate of 100 bpm or more, which may indicate a life-threatening condition. Sustained Tachycardia can lead to serious complications, including ventricular fibrillation, necessitating immediate medical intervention. A case study demonstrated the detection of sustained Tachycardia via an Apple Watch ECG, underscoring the importance of accurate ECG interpretation in real-life scenarios. This process is enhanced by salvaging previously obscured sections of recordings, ensuring critical data is not missed.
ST Elevation/Depression: Assess for ST segment changes that may indicate ischemia or infarction. Document any deviations from the baseline, as these changes can provide critical insights into the patient's cardiac status. The platform's ability to evolve with each use ensures that such deviations are accurately identified, enhancing diagnostic yield over time.
Comparison: Use previous ECGs for comparison to identify changes over time. This practice is vital for monitoring the progression of cardiac conditions and evaluating the effectiveness of treatment strategies. With advanced tools, the integration of historical data becomes more streamlined, allowing for a comprehensive analysis that addresses physiological variability and signal artifacts.

Follow Systematic Steps for ECG Analysis: A Practical Approach
Preparation: Ensure the ECG machine is in working order. Position the individual appropriately to minimize artifacts, which can obscure true cardiac signals. Research shows that prompt and precise ECG collection is essential, with delays frequently resulting in worse outcomes, especially in individuals with chest pain. The American Heart Association suggests that all individuals arriving at the emergency department with complaints of chest discomfort receive an ECG. However, only one-third of those with chest pain obtain an ECG within this timeframe. Utilizing Neural Cloud Solutions' platform can enhance this process by providing real-time analysis, ensuring clearer signals and more accurate readings.
Initial Review: Conduct a quick scan of the ECG to assess the overall rhythm and rate. This initial review is essential, as research shows that only about one-third of patients with chest pain receive an ECG within the recommended 10 minutes upon arrival at the emergency department, highlighting the need for efficiency in this step. MaxYield™ simplifies this initial review by automating repetitive tasks, enabling quicker data processing and evaluation.
Component Analysis: Methodically evaluate each component of the ECG, as detailed in the guidelines. This detailed examination is essential for understanding how ECG waves are explained to identify abnormalities. The American College of Cardiology/American Heart Association guidelines emphasize that an ECG should be interpreted within 10 minutes of arrival for patients with symptoms suspicious of myocardial infarction. With this tool, users can rapidly label P, QRS, and T Wave onsets and offsets, facilitating a more accurate analysis.
Pattern Recognition: Compare the ECG against established normal and abnormal patterns to identify discrepancies. This step is critical, as it informs diagnosis and interventions. The advanced algorithms of MaxYield™ support this process by extracting key features from ECG signals, enhancing the accuracy of pattern recognition.
Clinical Correlation: Relate the findings to the individual's clinical history and symptoms for a comprehensive assessment. This holistic approach ensures that the ECG evaluation is contextualized within the patient's overall health status, which is essential for effective treatment planning.
Report Generation: Compile the findings into a clear report, emphasizing any abnormalities and recommendations for further action. Effective communication of results is crucial for ensuring that healthcare providers can make informed decisions swiftly. Utilizing the features of this tool enables the creation of clean data sets, simplifying and enhancing report generation.

Utilize Advanced Tools for Enhanced ECG Analysis
ECG analysis presents several challenges, including the time-consuming nature of manual evaluations and the potential for human error. The platform addresses these issues by providing automation, which significantly decreases manual workload. This innovative platform processes over 200,000 heartbeats in under five minutes, enabling rapid and detailed beat-by-beat analysis. Such efficiency allows healthcare professionals to focus on interpretation rather than data processing.
One of the standout features of MaxYield™ is its advanced algorithms. By utilizing sophisticated algorithms, particularly convolutional neural networks, the platform effectively manages artifacts, ensuring that data quality is maintained. Additionally, the highlighting of P, QRS, and T Waves is part of the process where features streamline the workflow, enhancing signal clarity for accurate interpretation. This combination of features not only improves the quality of ECG data but also boosts the confidence of healthcare providers in their diagnostic capabilities.
Integrating ECG data with electronic medical records is another significant advantage of the platform. This allows for easy access and review of patient data, facilitating better-informed clinical decisions. Furthermore, the platform supports continuous learning systems that adapt and improve over time. With each use, the system enhances its performance, ensuring that healthcare providers are equipped with the most reliable tools for patient care.
In summary, the platform revolutionizes ECG analysis, providing insights where automation, advanced noise filtering, and seamless data integration are combined. These features not only streamline workflows but also enhance diagnostic accuracy, ultimately benefiting both healthcare providers and patients. By adopting such innovative technology, professionals can ensure they are at the forefront of cardiac care.
Conclusion
Understanding ECG waves and their significance is crucial for effective cardiac care. This article outlines the essential components of ECG analysis, including the P-wave, QRS complex, and T-wave, emphasizing their roles in diagnosing various cardiac conditions. The integration of advanced tools like the MaxYield™ platform is highlighted as a transformative approach that enhances diagnostic efficiency and accuracy, ultimately improving patient outcomes.
Key insights include:
- The importance of differentiating between normal and abnormal ECG patterns
- The systematic steps required for thorough ECG analysis
- The advantages of utilizing innovative technologies to streamline the process
Additionally, the article underscores the need for precise documentation and comparison of ECG readings over time to effectively monitor patient health.
In conclusion, embracing advanced ECG analysis tools and methodologies is imperative for healthcare professionals aiming to provide high-quality cardiac care. By leveraging technology that enhances the accuracy and speed of ECG interpretation, practitioners can make informed decisions that significantly impact patient health. The insights shared in this article serve as a valuable resource for anyone looking to deepen their understanding of ECG waves and improve their diagnostic capabilities.
Frequently Asked Questions
What does the P-wave signify in an ECG?
The P-wave signifies atrial depolarization, with a normal duration of less than 0.11 seconds and an amplitude not exceeding 3 mm.
What abnormalities in the P-wave can indicate?
Abnormalities in the P-wave, such as increased duration or specific morphologies, can indicate conditions like atrial enlargement, which is crucial for diagnosing atrial fibrillation and other cardiac issues.
How does the MaxYield™ platform assist in analyzing the P-wave?
The MaxYield™ platform can automatically label and analyze P-wave characteristics, allowing for rapid identification of potential abnormalities and enhancing diagnostic efficiency.
What does the QRS complex represent in an ECG?
The QRS complex represents ventricular depolarization, with a normal duration ranging from 0.06 to 0.10 seconds.
Why is the morphology of the QRS complex important?
The morphology of the QRS complex is vital for assessing cardiac health; variations can indicate underlying pathologies, such as myocardial infarction or conduction abnormalities.
How does the MaxYield™ system improve the assessment of the QRS complex?
The MaxYield™ system provides beat-by-beat assessment, enabling healthcare professionals to examine QRS morphology with accuracy and rapidity, ultimately supporting better patient outcomes.
What does the T-wave reflect in an ECG?
The T-wave reflects ventricular repolarization, characterized by an asymmetrical shape and a height that should not exceed 5 mm.
What abnormalities in the T-wave can indicate?
Abnormalities such as T-wave inversion or flattening can signal ischemia or other cardiac conditions.
How does the MaxYield™ platform enhance the evaluation of the T-wave?
The MaxYield™ platform facilitates thorough ECG evaluation by converting noisy recordings into clear insights, enabling effective monitoring of T-wave features and enhancing clinical decision-making.
Why is it important to document the characteristics of each ECG component?
Documenting each ECG component's characteristics is crucial for future reference and comparison, aiding in tracking changes over time and supporting clinical decision-making.
How does the MaxYield™ platform assist in documentation?
The MaxYield™ platform streamlines precise documentation, facilitating communication among healthcare professionals regarding patient status and treatment plans.
List of Sources
- Identify Key ECG Components: P-Wave, QRS Complex, and T-Wave
- researchgate.net (https://researchgate.net/publication/335657956_Abnormalities_State_Detection_from_P-Wave_QRS_Complex_and_T-Wave_in_Noisy_ECG)
- nature.com (https://nature.com/articles/s41598-023-40965-1)
- emedicine.medscape.com (https://emedicine.medscape.com/article/1894014-overview)
- ahajournals.org (https://ahajournals.org/doi/10.1161/CIRCEP.121.010435)
- pubmed.ncbi.nlm.nih.gov (https://pubmed.ncbi.nlm.nih.gov/37944176)
- Differentiate Normal and Abnormal ECG Patterns
- aedusa.com (https://aedusa.com/knowledge/everything-you-need-to-know-about-v-tach?srsltid=AfmBOoqqpkStk9c7xSkjuXK9X0k_Ih_QroiAx4vOQaSo3m9_OgbWd3vv)
- ahajournals.org (https://ahajournals.org/doi/10.1161/CIRCRESAHA.120.316340)
- qaly.co (https://qaly.co/post/ventricular-tachycardia-vtach-can-your-watch-ecg-detect-it)
- ecgwaves.com (https://ecgwaves.com/topic/ventricular-tachycardia-vt-ecg-treatment-causes-management)
- my.clevelandclinic.org (https://my.clevelandclinic.org/health/diseases/17616-ventricular-tachycardia)
- Follow Systematic Steps for ECG Analysis: A Practical Approach
- 10 Inspiring Patient Experience Quotes | Relias (https://relias.com/blog/patient-experience-quotes)
- researchgate.net (https://researchgate.net/publication/310690637_Statistical_Assessment_and_Calibration_of_Numerical_ECG_Models)
- sciencedirect.com (https://sciencedirect.com/science/article/abs/pii/S0099176720300854)
- pmc.ncbi.nlm.nih.gov (https://pmc.ncbi.nlm.nih.gov/articles/PMC5589074)
- devorerecruiting.com (https://devorerecruiting.com/blog/top-inspirational-quotes-from-famous-healthcare-personalities.htm)
- Utilize Advanced Tools for Enhanced ECG Analysis
- usa.philips.com (https://usa.philips.com/a-w/about/news/archive/standard/news/press/2025/philips-launches-ecg-ai-marketplace-to-enhance-early-cardiac-diagnosis.html)
- theneuralcloud.com (https://theneuralcloud.com/post/7-key-benefits-of-ecg-ai-readers-for-enhanced-cardiac-diagnostics)
- theneuralcloud.com (https://theneuralcloud.com/post/10-innovations-in-ai-ecg-interpretation-for-enhanced-cardiac-care)
- medicalxpress.com (https://medicalxpress.com/news/2025-07-ai-tool-hidden-heart-disease.html)