Overview
The article highlights the significance of ECG Q wave analysis for health tech developers, particularly in diagnosing cardiac conditions such as myocardial infarction. ECG analysis presents various challenges, including noise interference and the complexity of interpretation, which can hinder accurate diagnosis.
The MaxYield™ platform addresses these challenges with advanced features that enhance ECG interpretation. Key features include noise filtering, which minimizes interference, and automated labeling, which streamlines the analysis process. These tools not only improve the accuracy of ECG readings but also save valuable time for healthcare professionals.
The advantages of using the MaxYield™ platform are substantial. By enhancing the accuracy and efficiency of ECG interpretation, healthcare providers can make quicker, more informed decisions, ultimately leading to better patient outcomes. This platform empowers professionals to focus on patient care rather than getting bogged down by technical difficulties.
In summary, the MaxYield™ platform stands out as a vital tool for health tech developers and healthcare professionals alike. Its innovative features directly address the challenges of ECG analysis, providing significant benefits that enhance diagnostic capabilities and improve patient care.
Introduction
Understanding the complexities of the ECG Q wave is crucial for health tech developers focused on improving cardiac care. This seemingly simple deflection holds significant diagnostic importance, acting as a key indicator for various heart conditions, including myocardial infarction.
As technology advances, enabling more accurate ECG interpretations, a pressing question arises: how can developers harness these innovations to facilitate precise and timely diagnoses?
This article explores the characteristics of the Q wave, its clinical implications, and the pivotal role of AI solutions in ECG analysis, providing valuable insights for those committed to enhancing patient outcomes.
Define the Q Wave: Characteristics and Importance in ECG
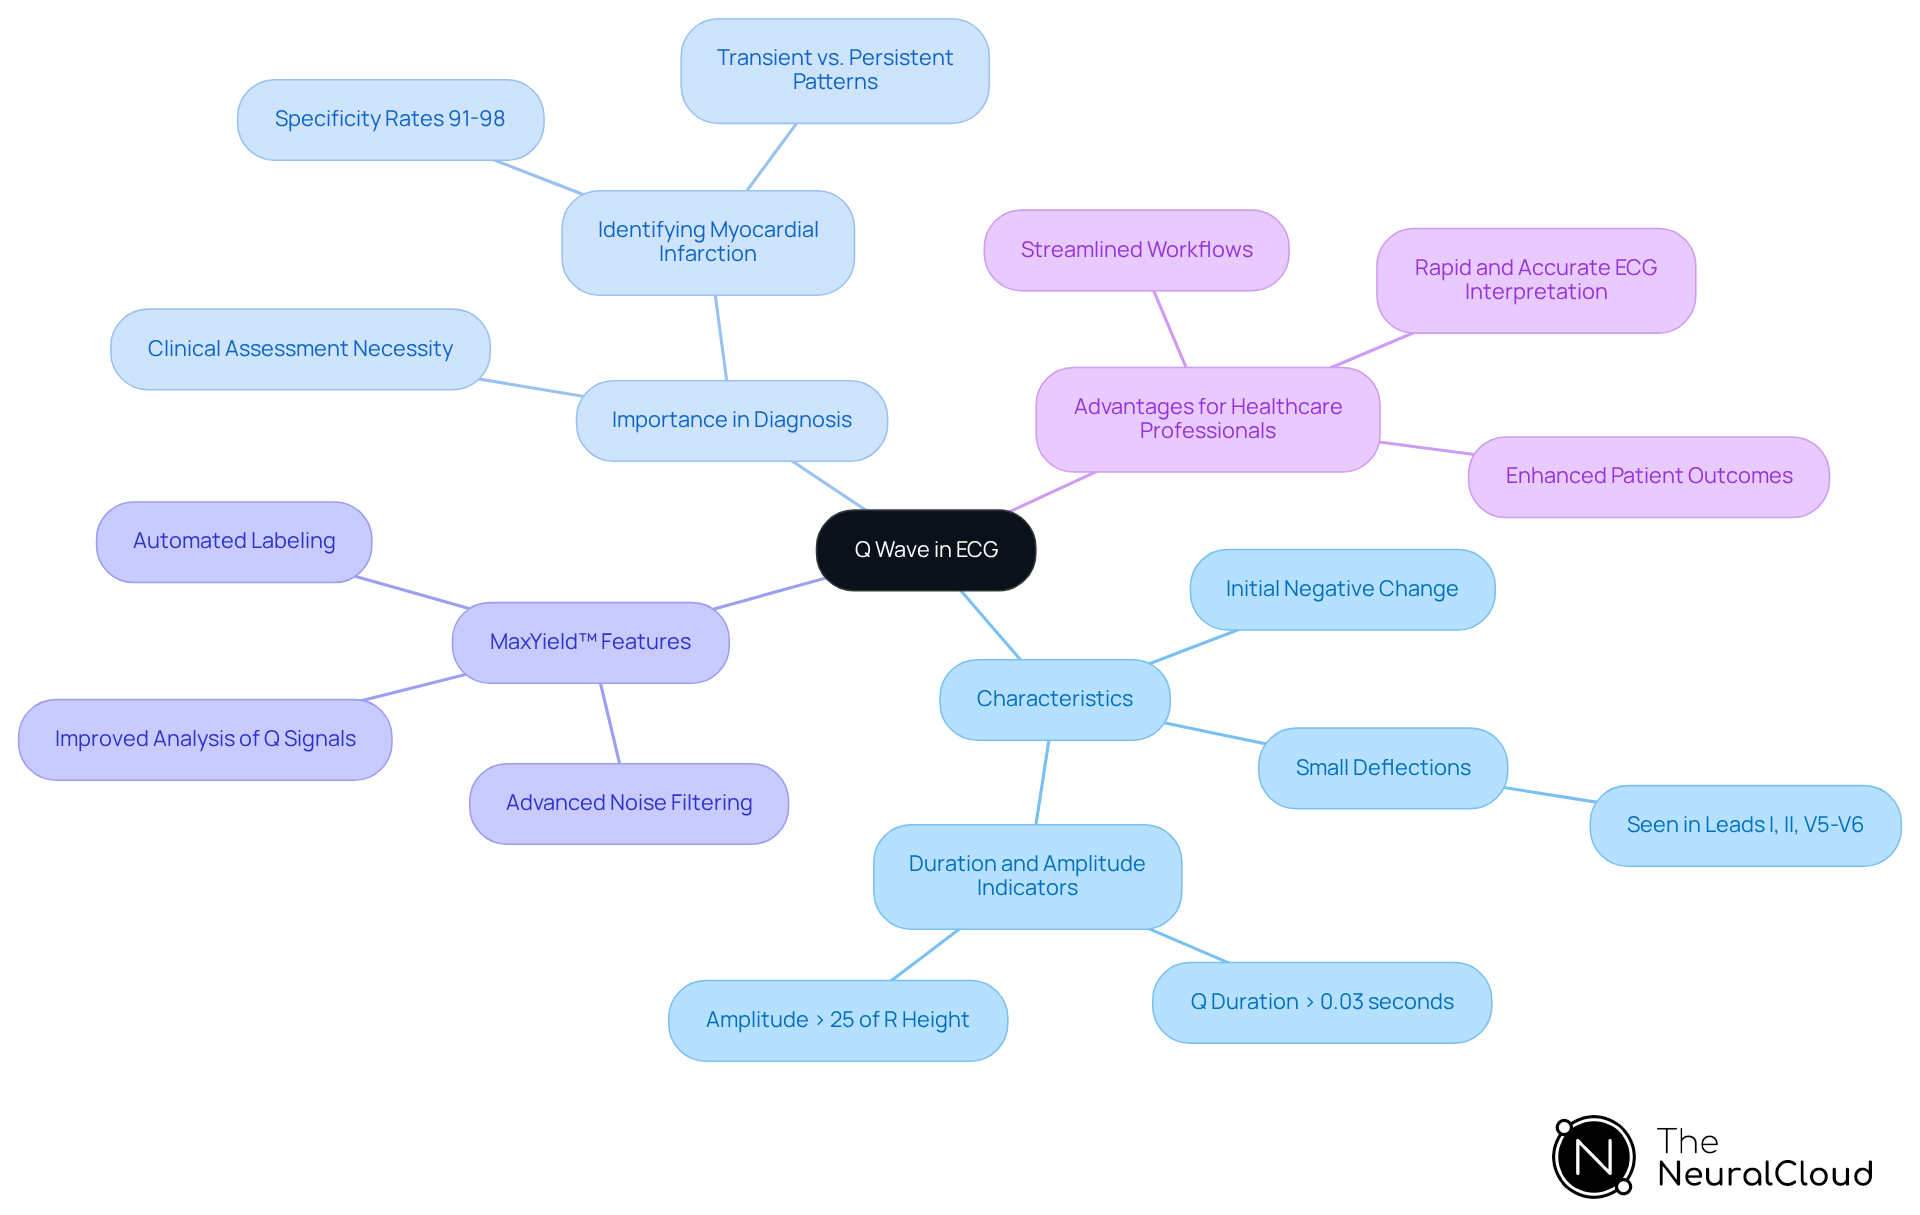
The ECG Q wave represents the initial negative change in the QRS complex, signaling the start of ventricular depolarization. Typically occurring after the P component, it is vital for identifying various cardiac conditions. Normal Q deflections are small and can be seen in leads I, II, and V5-V6, indicating healthy left-to-right depolarization of the interventricular septum. Recognizing the typical characteristics of the Q deflection is crucial for differentiating between physiological and pathological changes, which may point to underlying heart issues such as myocardial infarction (MI). For example, a Q duration exceeding 0.03 seconds or an amplitude greater than 25% of the R height may suggest pathological alterations, warranting further clinical assessment.
Research indicates that identifying the ECG Q wave patterns significantly enhances the accuracy of diagnosing heart attacks, with specificity rates reported between 91% and 98%. Additionally, case studies highlight that transient ECG Q wave patterns can emerge during ischemic episodes, while persistent ECG Q wave patterns often indicate a history of myocardial infarction. This underscores the importance of thorough ECG interpretation in clinical practice.
MaxYield™ platform from Neural Cloud Solutions addresses the challenges in ECG analysis by offering advanced noise filtering and automated labeling. These features help tackle issues related to physiological variability and signal artifacts, leading to clearer insights and more efficient clinical decision-making.
Features of MaxYield™:
- Advanced noise filtering
- Automated labeling
- Improved analysis of Q signals
Advantages for Healthcare Professionals:
- Streamlined workflows
- Rapid and accurate ECG interpretation
- Enhanced patient outcomes
By integrating MaxYield™, developers can optimize their processes, ensuring that ECG interpretations are both swift and precise, ultimately benefiting patient care.

Analyze Q Wave Duration and Amplitude: Key Metrics for ECG Interpretation
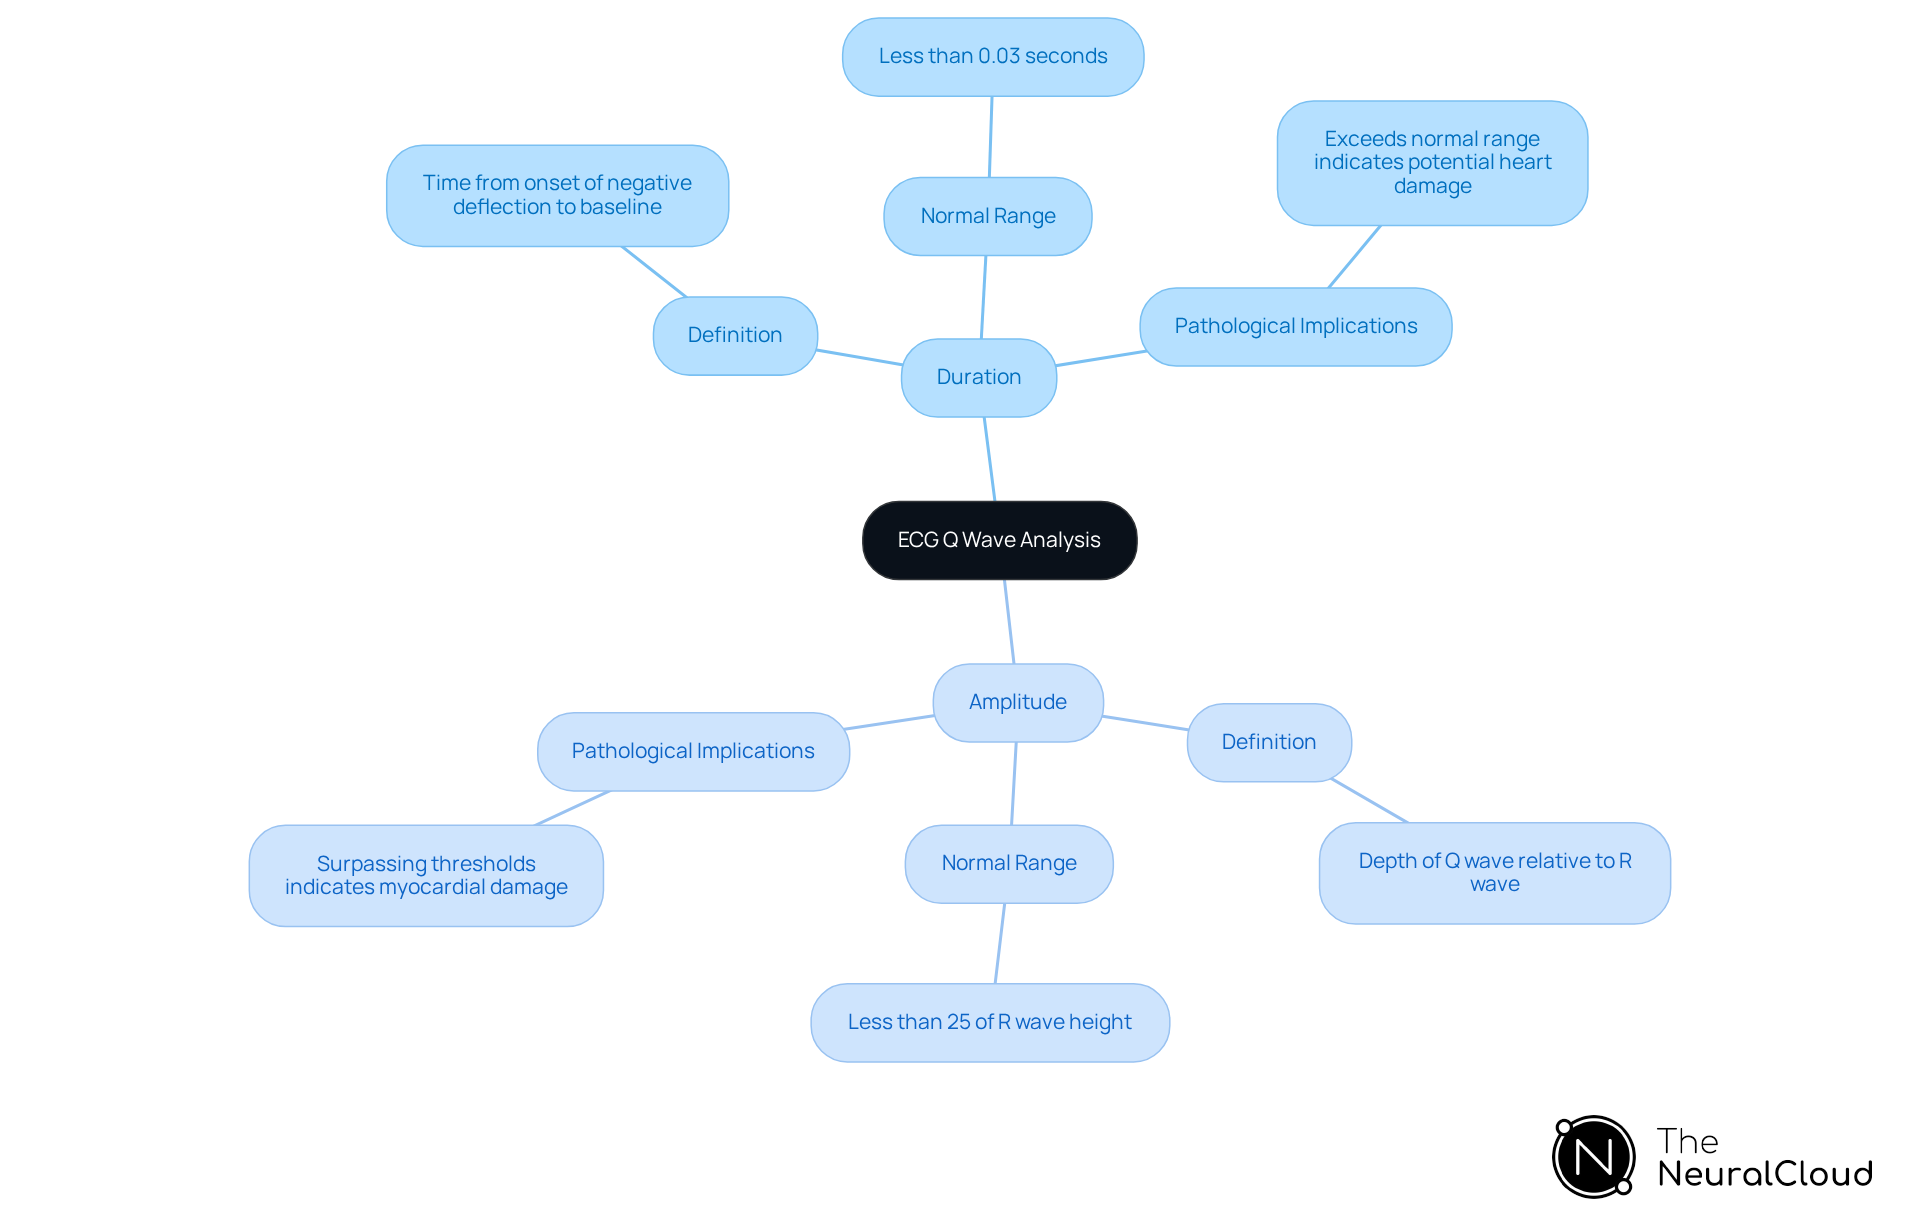
To effectively analyze the ECG Q wave, developers should focus on two key metrics: duration and amplitude. The duration of the Q component is defined as the time from the onset of the negative deflection to its return to baseline, with a normal Q component lasting less than 0.03 seconds. Pathological Q patterns, which may suggest heart damage, typically exceed this duration. Regarding amplitude, the Q's depth should be less than 25% of the height of the R wave in the same lead. If the Q deflection surpasses these thresholds, it may indicate myocardial damage or other cardiac irregularities.
For accurate diagnosis, pathological Q deflections must be present in at least two adjacent leads, highlighting the importance of precise measurement in clinical settings. Developers should implement algorithms that automatically assess these parameters, facilitating timely and accurate diagnoses for clinicians. Recent advancements in measuring the ECG Q wave duration and amplitude have underscored the significance of these metrics in ECG interpretation, reinforcing the necessity for robust analytical tools in health technology. By focusing on these features, healthcare professionals can enhance their diagnostic capabilities, ultimately improving patient outcomes.

Identify Abnormal Q Waves: Clinical Implications and Diagnostic Significance
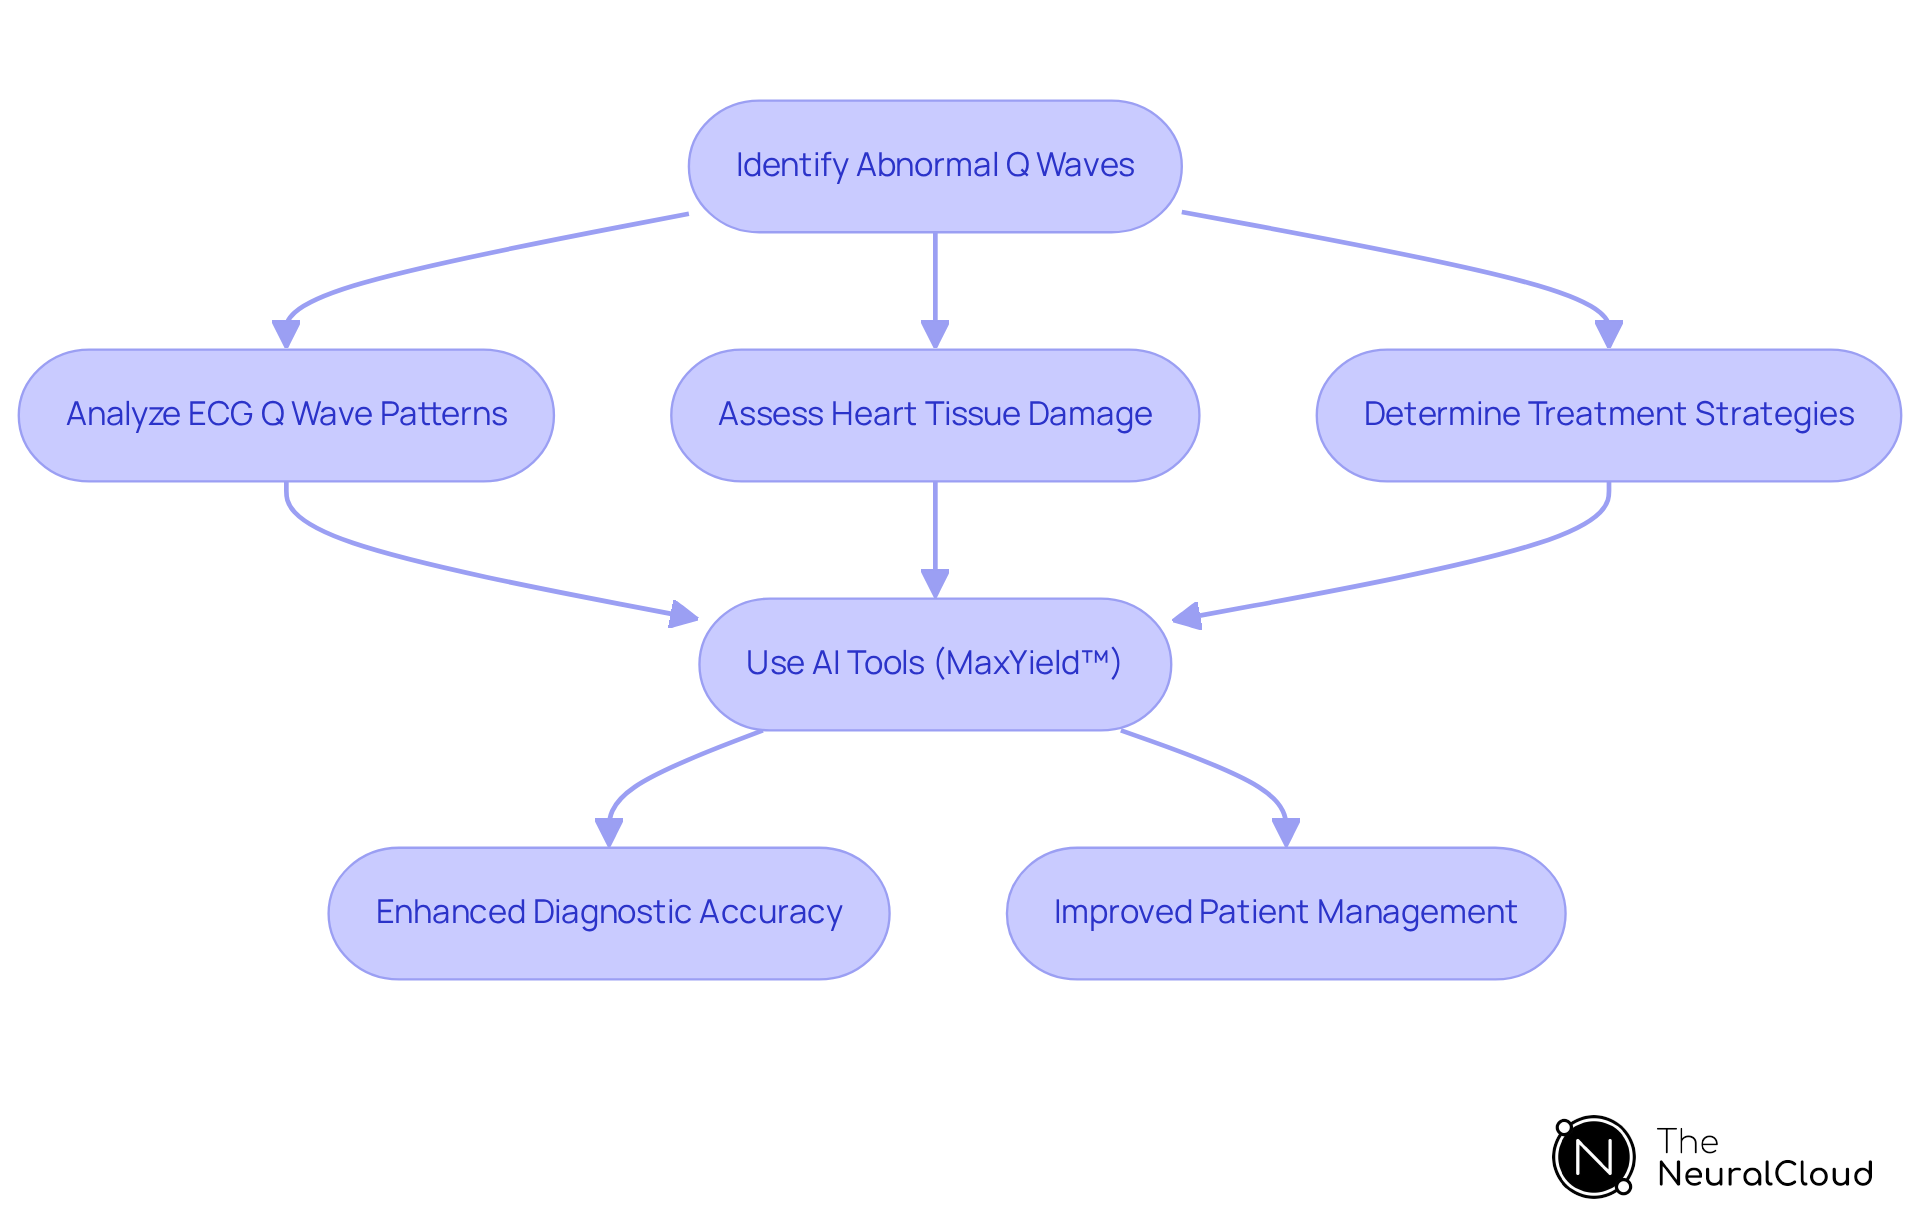
Irregular ECG Q wave patterns serve as critical indicators of heart disease, particularly concerning heart attacks. Healthcare providers analyze the presence of the ECG Q wave deflections across multiple leads to assess the extent of heart tissue damage. Pathological Q patterns are characterized by their width and depth, and an ECG Q wave that lasts longer than 0.04 seconds or has an amplitude exceeding 1 mm is deemed abnormal. These variations often signify heart tissue death, which is essential for informing treatment strategies.
Recent research shows that persistent ECG Q wave deflections following reperfusion correlate with increased one-year mortality rates and reduced left ventricular ejection fraction (LVEF), highlighting the prognostic significance of the ECG Q wave. For example, patients experiencing an ECG Q wave myocardial infarction had an LVEF of 37 ± 8%, notably lower than the 45 ± 8% seen in non-Q-wave MI patients. As Ronak Delewi noted, 'the connection of ECG Q wave components with infarct size is strongest when applying the classic Q criteria.'
To enhance ECG analysis, developers of ECG analysis tools should leverage advanced solutions like Neural Cloud Solutions' MaxYield™, which utilizes cutting-edge AI technology to filter out noise and accurately detect Q signals amidst artifacts. This capability not only boosts diagnostic accuracy but also streamlines workflows, providing clinicians with vital insights that can significantly impact patient management and outcomes.
Testimonials from users emphasize the effectiveness of MaxYield™ in transforming noisy recordings into clear waveforms, further validating its role in improving ECG analysis.
Features of MaxYield™
- Advanced AI Technology: Filters noise effectively to enhance signal clarity.
- Precise ECG Q Wave Identification: Accurately detects ECG Q waves even in challenging conditions.
- Streamlined Workflows: Facilitates quicker analysis, allowing clinicians to focus on patient care.
Advantages for Healthcare Professionals
- Improved Diagnostic Precision: Enhances the accuracy of ECG interpretations.
- Informed Patient Management: Provides critical insights that guide treatment decisions.
- Enhanced Workflow Efficiency: Saves time, enabling healthcare providers to manage more patients effectively.

Integrate Advanced Technologies: Enhancing Q Wave Analysis with AI Solutions
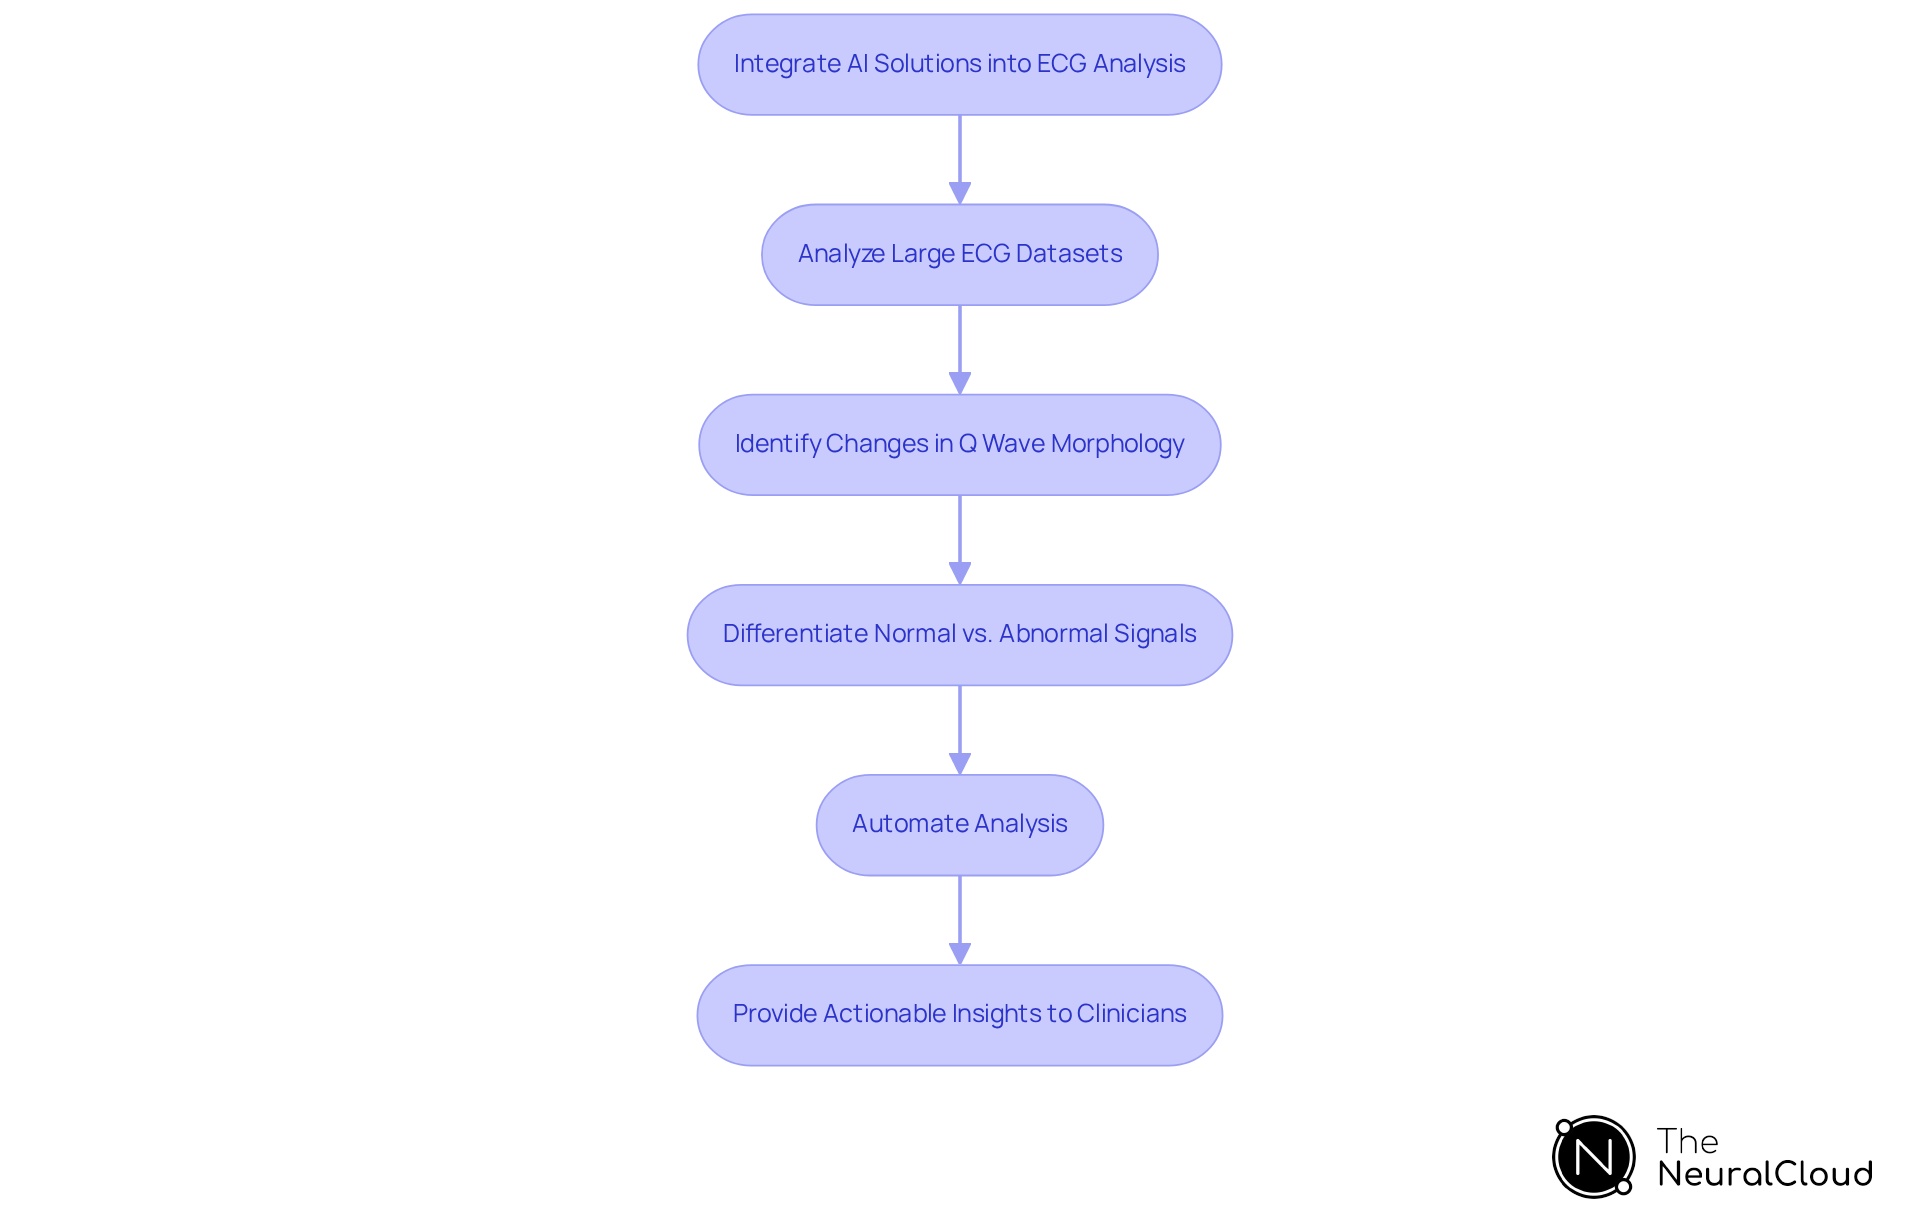
The integration of AI solutions into ECG Q wave analysis is poised to transform ECG interpretation. Advanced algorithms can quickly analyze large ECG datasets, pinpointing subtle changes in the ECG Q wave morphology that may signal cardiac issues. Machine learning models, trained on extensive datasets, excel at recognizing patterns associated with both normal and abnormal Q phenomena, significantly enhancing diagnostic accuracy.
For example, AI can effectively differentiate between physiological Q signals and those indicative of myocardial infarction by analyzing features such as duration, amplitude, and lead-specific characteristics of the ECG Q wave. Recent studies have shown that AI algorithms can achieve an impressive accuracy of 94% in classifying heartbeats, highlighting their potential in clinical environments. Developers should focus on creating AI-driven tools that not only automate the analysis of ECG Q wave but also provide actionable insights to clinicians, ultimately improving patient outcomes.
As AI technology continues to advance, its role in refining the interpretation of the ECG Q wave will become increasingly essential, paving the way for more precise and efficient cardiac care. By addressing the challenges in ECG analysis, AI solutions like MaxYield™ can enhance the accuracy of diagnoses and support healthcare professionals in delivering better patient care.

Conclusion
In the realm of cardiac health, the ECG Q wave stands out as a vital indicator, marking the initial phase of ventricular depolarization. For healthcare developers and professionals, grasping its characteristics and implications is crucial. Accurate Q wave analysis can significantly improve the diagnosis of heart conditions, particularly myocardial infarction. The MaxYield™ platform exemplifies how advanced technologies empower clinicians to interpret ECGs with enhanced precision, ultimately leading to better patient outcomes.
Key insights emphasize the importance of measuring Q wave duration and amplitude. Deviations from normal parameters can indicate underlying cardiac issues. The diagnostic significance of abnormal Q waves, especially concerning heart attacks, highlights the need for robust analytical tools. By leveraging AI solutions, developers can streamline ECG analysis, facilitate rapid interpretation, and enable healthcare providers to make informed decisions based on clear, accurate data.
Given these advancements, it is essential for health tech developers to prioritize the integration of AI-driven tools in ECG analysis. This approach not only enhances diagnostic accuracy but also contributes to the overall improvement of patient care in cardiology. Embracing these technologies paves the way for more effective monitoring and treatment of heart diseases, ultimately leading to better health outcomes for patients.
Frequently Asked Questions
What does the Q wave represent in an ECG?
The Q wave represents the initial negative change in the QRS complex, signaling the start of ventricular depolarization.
When does the Q wave typically occur in relation to other components of the ECG?
The Q wave typically occurs after the P component.
What is the significance of the Q wave in diagnosing cardiac conditions?
The Q wave is vital for identifying various cardiac conditions, as its characteristics can differentiate between physiological and pathological changes, indicating potential heart issues such as myocardial infarction (MI).
What are the normal characteristics of a Q wave?
Normal Q deflections are small and can be observed in leads I, II, and V5-V6, indicating healthy left-to-right depolarization of the interventricular septum.
What Q wave characteristics may suggest pathological alterations?
A Q duration exceeding 0.03 seconds or an amplitude greater than 25% of the R height may suggest pathological alterations, warranting further clinical assessment.
How does the identification of ECG Q wave patterns impact the diagnosis of heart attacks?
Identifying ECG Q wave patterns significantly enhances the accuracy of diagnosing heart attacks, with specificity rates reported between 91% and 98%.
What do transient and persistent Q wave patterns indicate?
Transient ECG Q wave patterns can emerge during ischemic episodes, while persistent Q wave patterns often indicate a history of myocardial infarction.
What is the MaxYield™ platform and how does it assist in ECG analysis?
The MaxYield™ platform from Neural Cloud Solutions offers advanced noise filtering and automated labeling, helping to address challenges in ECG analysis related to physiological variability and signal artifacts.
What are the advantages of using MaxYield™ for healthcare professionals?
The advantages include streamlined workflows, rapid and accurate ECG interpretation, and enhanced patient outcomes.
How does integrating MaxYield™ benefit ECG interpretation processes?
Integrating MaxYield™ optimizes processes, ensuring that ECG interpretations are both swift and precise, ultimately benefiting patient care.


