Overview
The article provides a systematic guide for developers to master ECG strip analysis, emphasizing the importance of understanding the ECG waveform components and a structured approach to interpretation. It outlines detailed steps for analyzing ECG strips and highlights the role of the MaxYield™ platform in enhancing diagnostic accuracy through advanced noise filtering and signal recognition. By addressing common challenges faced in ECG interpretation, the article sets the stage for a deeper exploration of the platform's features.
MaxYield™ offers several key features that significantly improve ECG analysis. Its advanced noise filtering capabilities ensure that the ECG waveform is clear and accurate, allowing for better interpretation by healthcare professionals. Additionally, the platform's signal recognition technology enhances the detection of critical waveform components, which is essential for accurate diagnosis. These features collectively address the prevalent issues in ECG analysis and provide a robust solution for practitioners.
The advantages of using the MaxYield™ platform are substantial. Healthcare professionals can expect improved diagnostic accuracy, leading to better patient outcomes. The structured approach to ECG analysis not only saves time but also reduces the likelihood of errors, making it an invaluable tool in clinical settings. By leveraging these benefits, practitioners can enhance their proficiency in ECG interpretation and ultimately provide higher quality care to their patients.
Introduction
Mastering the intricacies of ECG strip analysis is not merely a skill; it is a vital necessity in the healthcare landscape, where accurate diagnostics can significantly influence patient outcomes. This guide provides a comprehensive, step-by-step approach for developers eager to deepen their understanding of ECG waveforms and the systematic methods for interpreting them.
However, common pitfalls, such as lead misplacement and artifact interference, present challenges that can hinder effective analysis. Thus, it raises the question: how can one ensure that their analysis yields reliable and actionable insights?
Understand ECG Basics and Waveform Components
To master ECG strip analysis, familiarizing yourself with the fundamental components of an ECG waveform is essential.
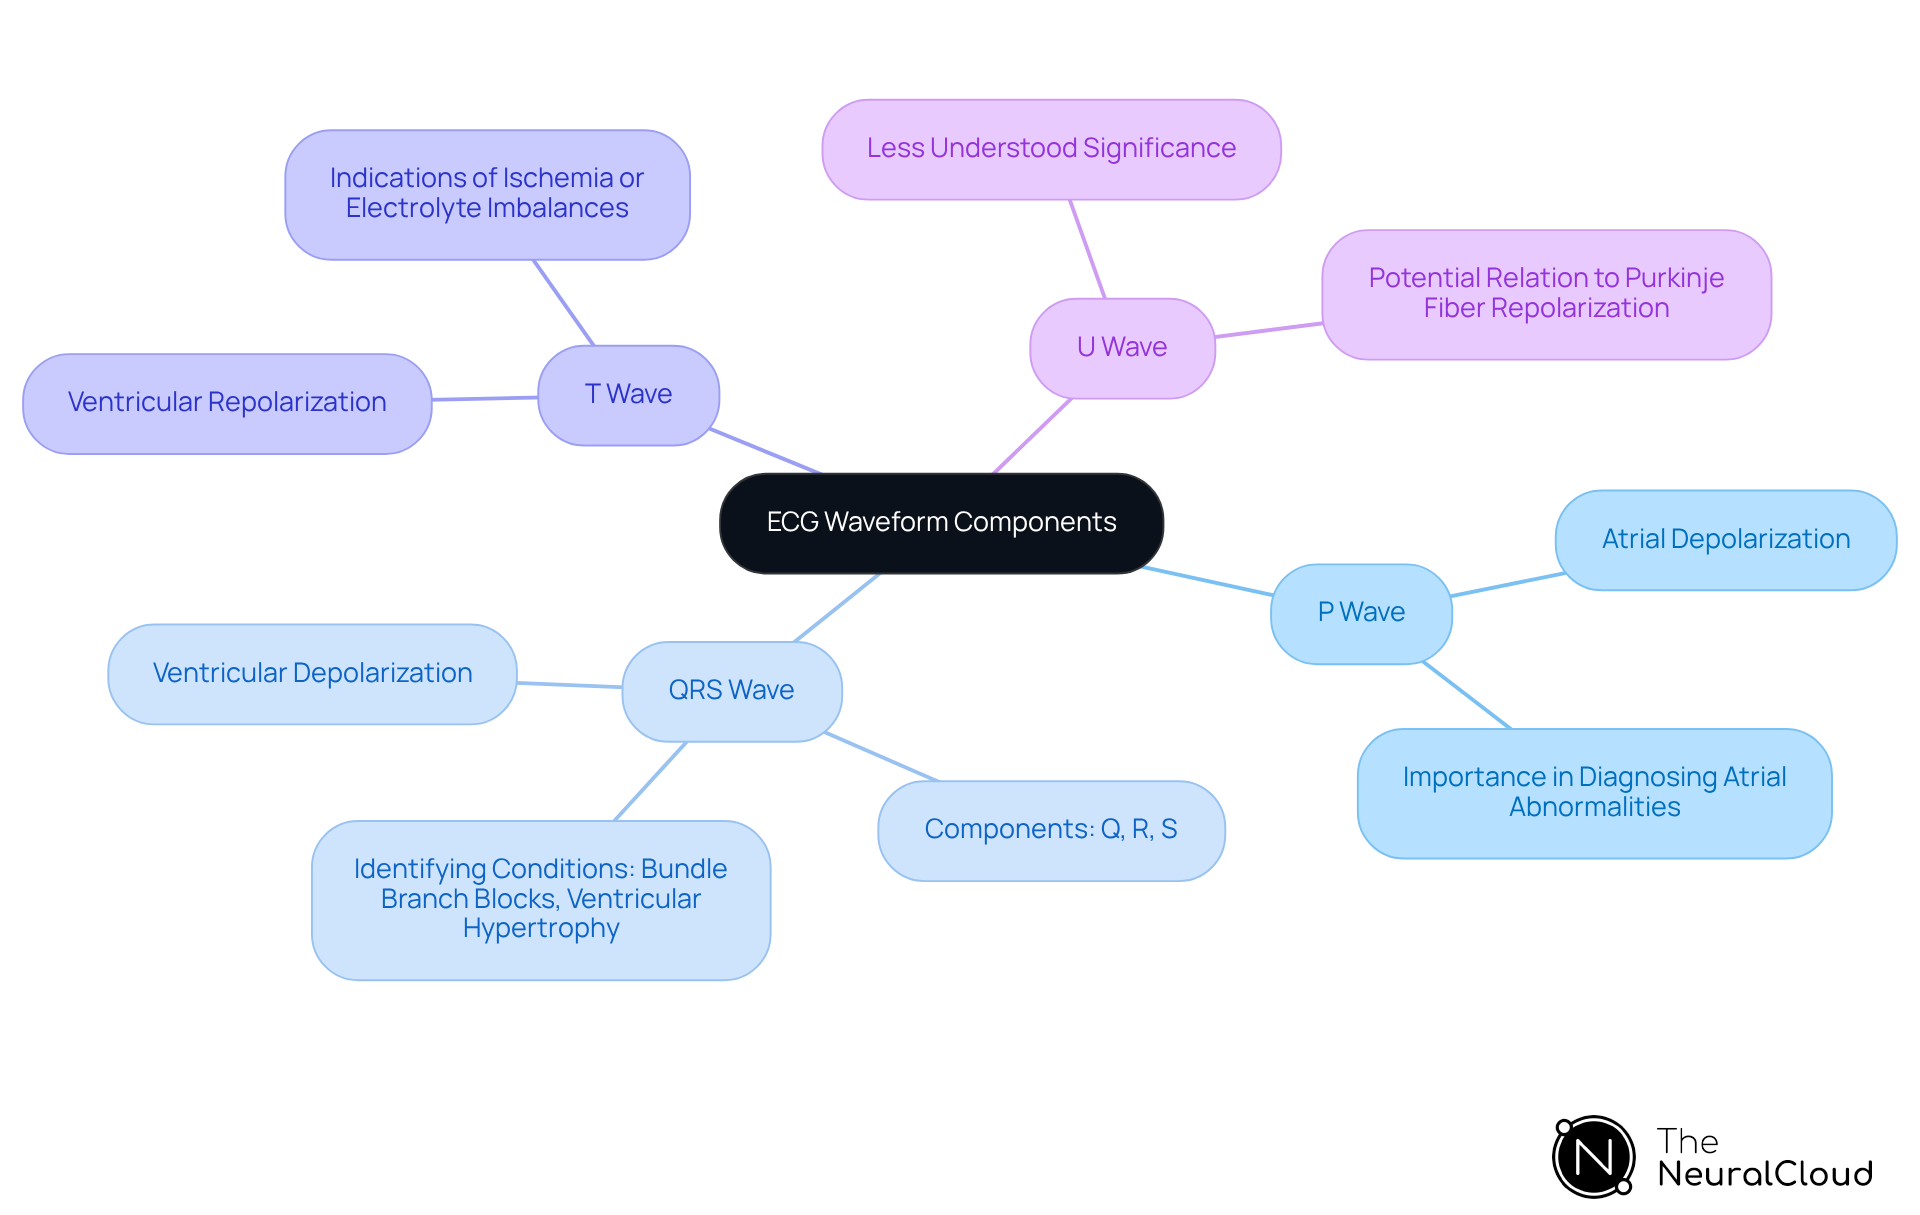
The P Wave represents atrial depolarization, indicating the electrical activity that triggers atrial contraction. Cardiologists emphasize the importance of accurately recognizing the P signal, as it is crucial for diagnosing atrial abnormalities.
The QRS Wave reflects ventricular depolarization and is vital for understanding the heart's pumping action. This wave consists of three components: the Q component, R component, and S component. Analyzing the QRS complex helps identify conditions such as bundle branch blocks and ventricular hypertrophy.
The T Wave indicates ventricular repolarization, showcasing the recovery phase of the ventricles after contraction. Irregularities in the T component can signal issues like ischemia or electrolyte imbalances, making its interpretation essential in medical environments.
The U Wave, although occasionally present, has less understood significance. It may relate to the repolarization of the Purkinje fibers and can provide additional insights into cardiac health when analyzed alongside other components.
Understanding these components is vital for interpreting the rhythm and identifying abnormalities in the ECG strip. A study revealed that healthcare providers accurately read ECGs only 56.4% of the time, underscoring the necessity for thorough training in ECG interpretation. By mastering these waveform components, healthcare professionals can enhance their diagnostic capabilities and ultimately improve patient outcomes.

Follow a Systematic Approach to ECG Strip Analysis
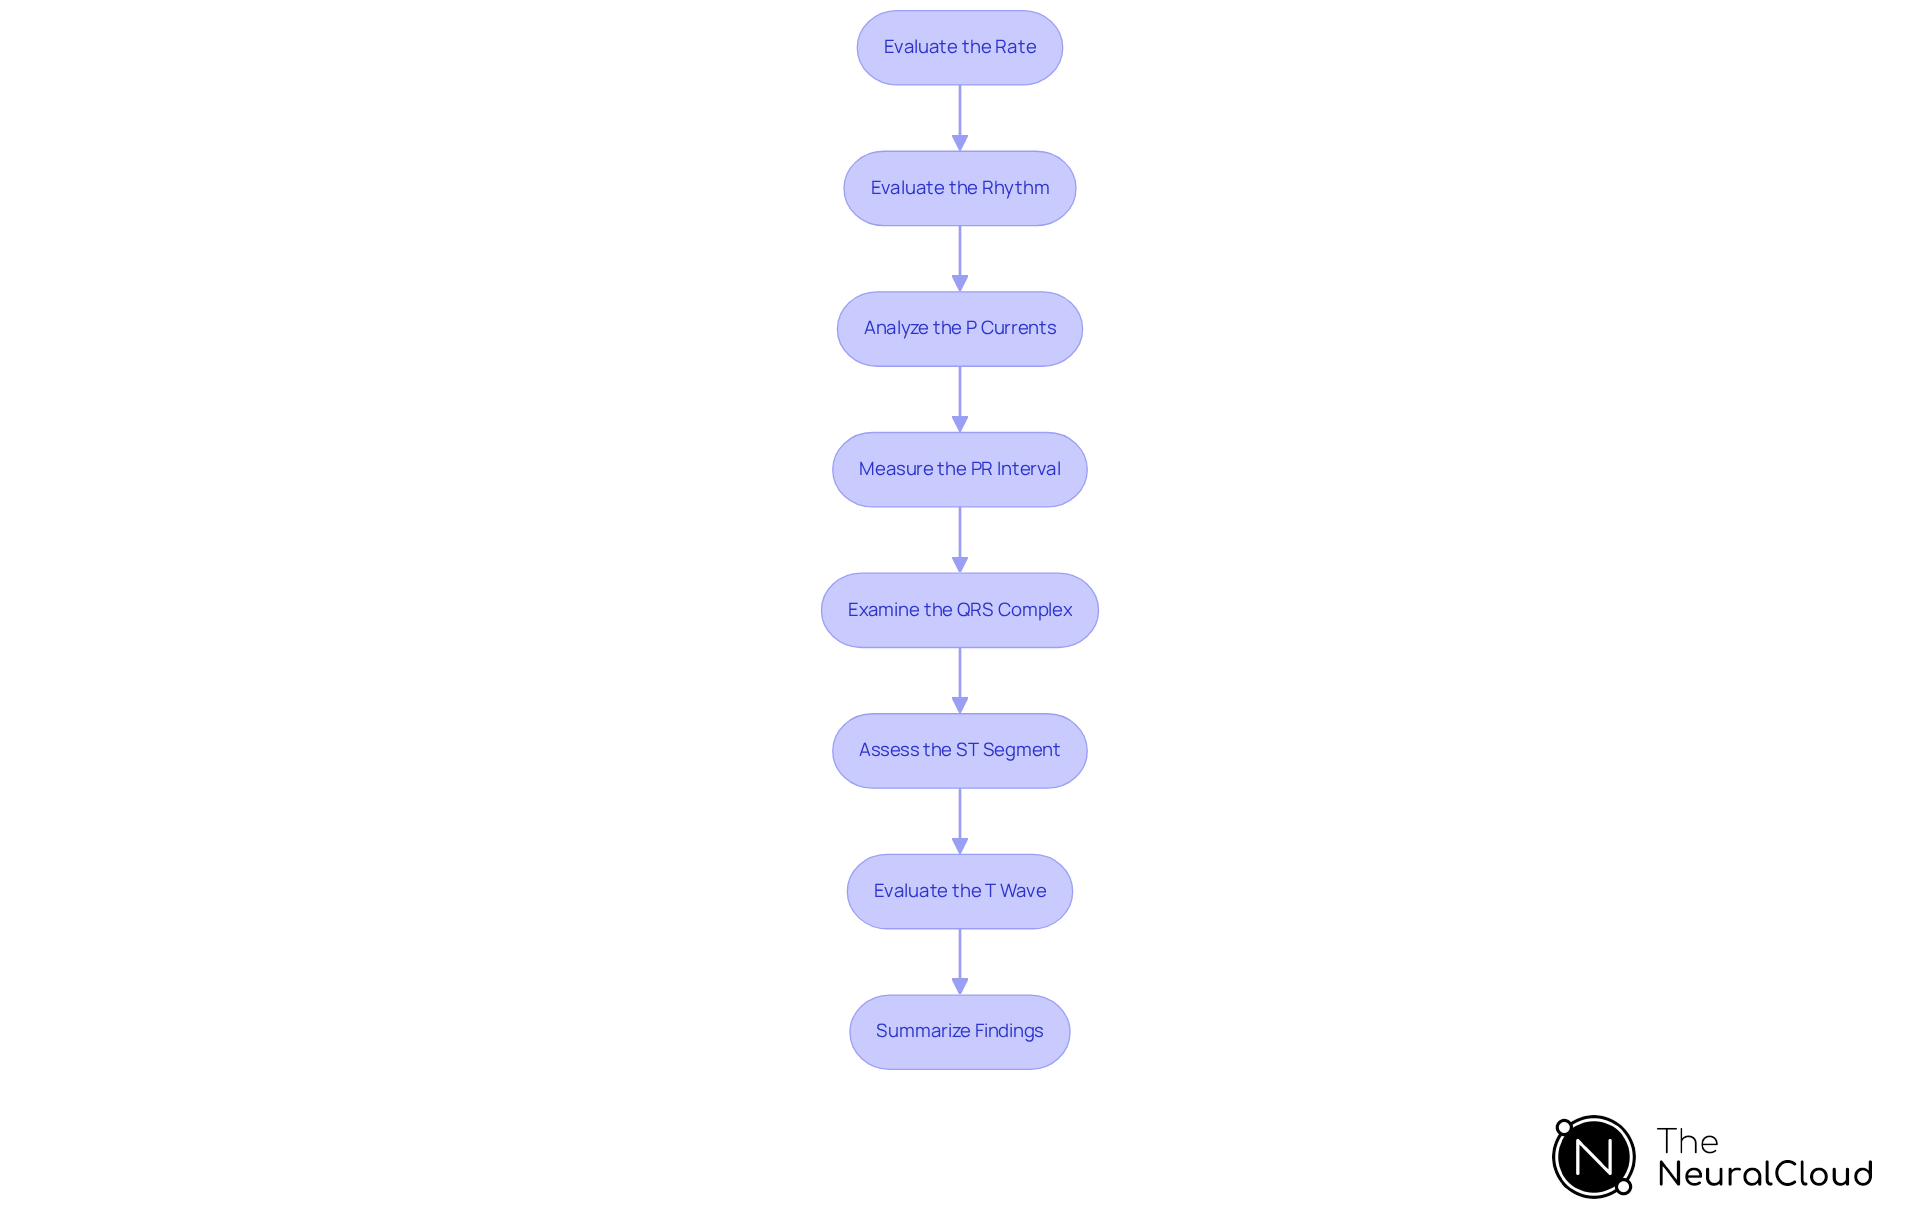
To systematically analyze an ECG strip, follow these steps:
- Evaluate the Rate: Count the number of QRS waves in a 10-second strip and multiply by 6 to determine the heart rate. A normal heart rate ranges from 60 to 99 beats per minute, with tachycardia defined as a heart rate exceeding 100 beats per minute. The MaxYield™ platform enhances this step by precisely recognizing QRS patterns, even in noisy recordings.
- Evaluate the Rhythm: Assess the regularity of the R-R intervals. Are they consistent or irregular? This observation can indicate underlying arrhythmias. MaxYield™ aids in distinguishing these intervals by filtering out artifacts that may obscure the rhythm.
- Analyze the P Currents: Identify the presence and shape of P currents. Ensure they are present before each QRS wave, reflecting normal atrial depolarization. The platform's signal recognition capabilities assist in accurately identifying P waves in challenging recordings.
- Measure the PR Interval: Calculate the duration from the start of the P signal to the initiation of the QRS structure. A normal PR interval ranges from 120 to 200 milliseconds. MaxYield™ provides precise measurements, even in the presence of baseline wander.
- Examine the QRS Complex: Measure its duration and morphology. A normal QRS duration is less than 120 milliseconds; a widened QRS complex may indicate a bundle branch block. The platform's advanced algorithms adapt to various noise levels, ensuring accurate analysis.
- Assess the ST Segment: Look for elevation or depression, which can indicate ischemia or infarction. ST segment elevation of ≥2 mm in men or ≥1.5 mm in women in leads V2-V3 is significant for STEMI. MaxYield™ enhances the detection of subtle ST segment changes by filtering out noise.
- Evaluate the T Wave: Check for abnormalities in shape or direction, which can signify various cardiac conditions. T-wave inversions or flattening may indicate ischemia. The platform's capabilities enable clearer visualization of T signals, assisting in precise interpretation.
- Summarize Findings: Compile your observations to form a comprehensive interpretation of the ECG strip. This systematic approach aids in diagnosing conditions such as atrial fibrillation, heart blocks, and ventricular hypertrophy.
Incorporating these steps into your analysis can enhance diagnostic accuracy and efficiency, ultimately improving patient outcomes. The MaxYield™ platform from Neural Cloud Solutions significantly assists this process by employing advanced noise filtering and unique signal recognition, enabling healthcare professionals to recover previously hidden parts of recordings and enhance diagnostic yield. Continuous education and practice are essential for mastering ECG interpretation, as evidenced by the need for improved training across all levels of healthcare professionals. As Yasar Sattar, MD, emphasizes, "Errors in the analysis can lead to misdiagnosis, delaying the appropriate treatment.

Troubleshoot Common ECG Interpretation Issues
When interpreting ECG strips, various common issues may arise:
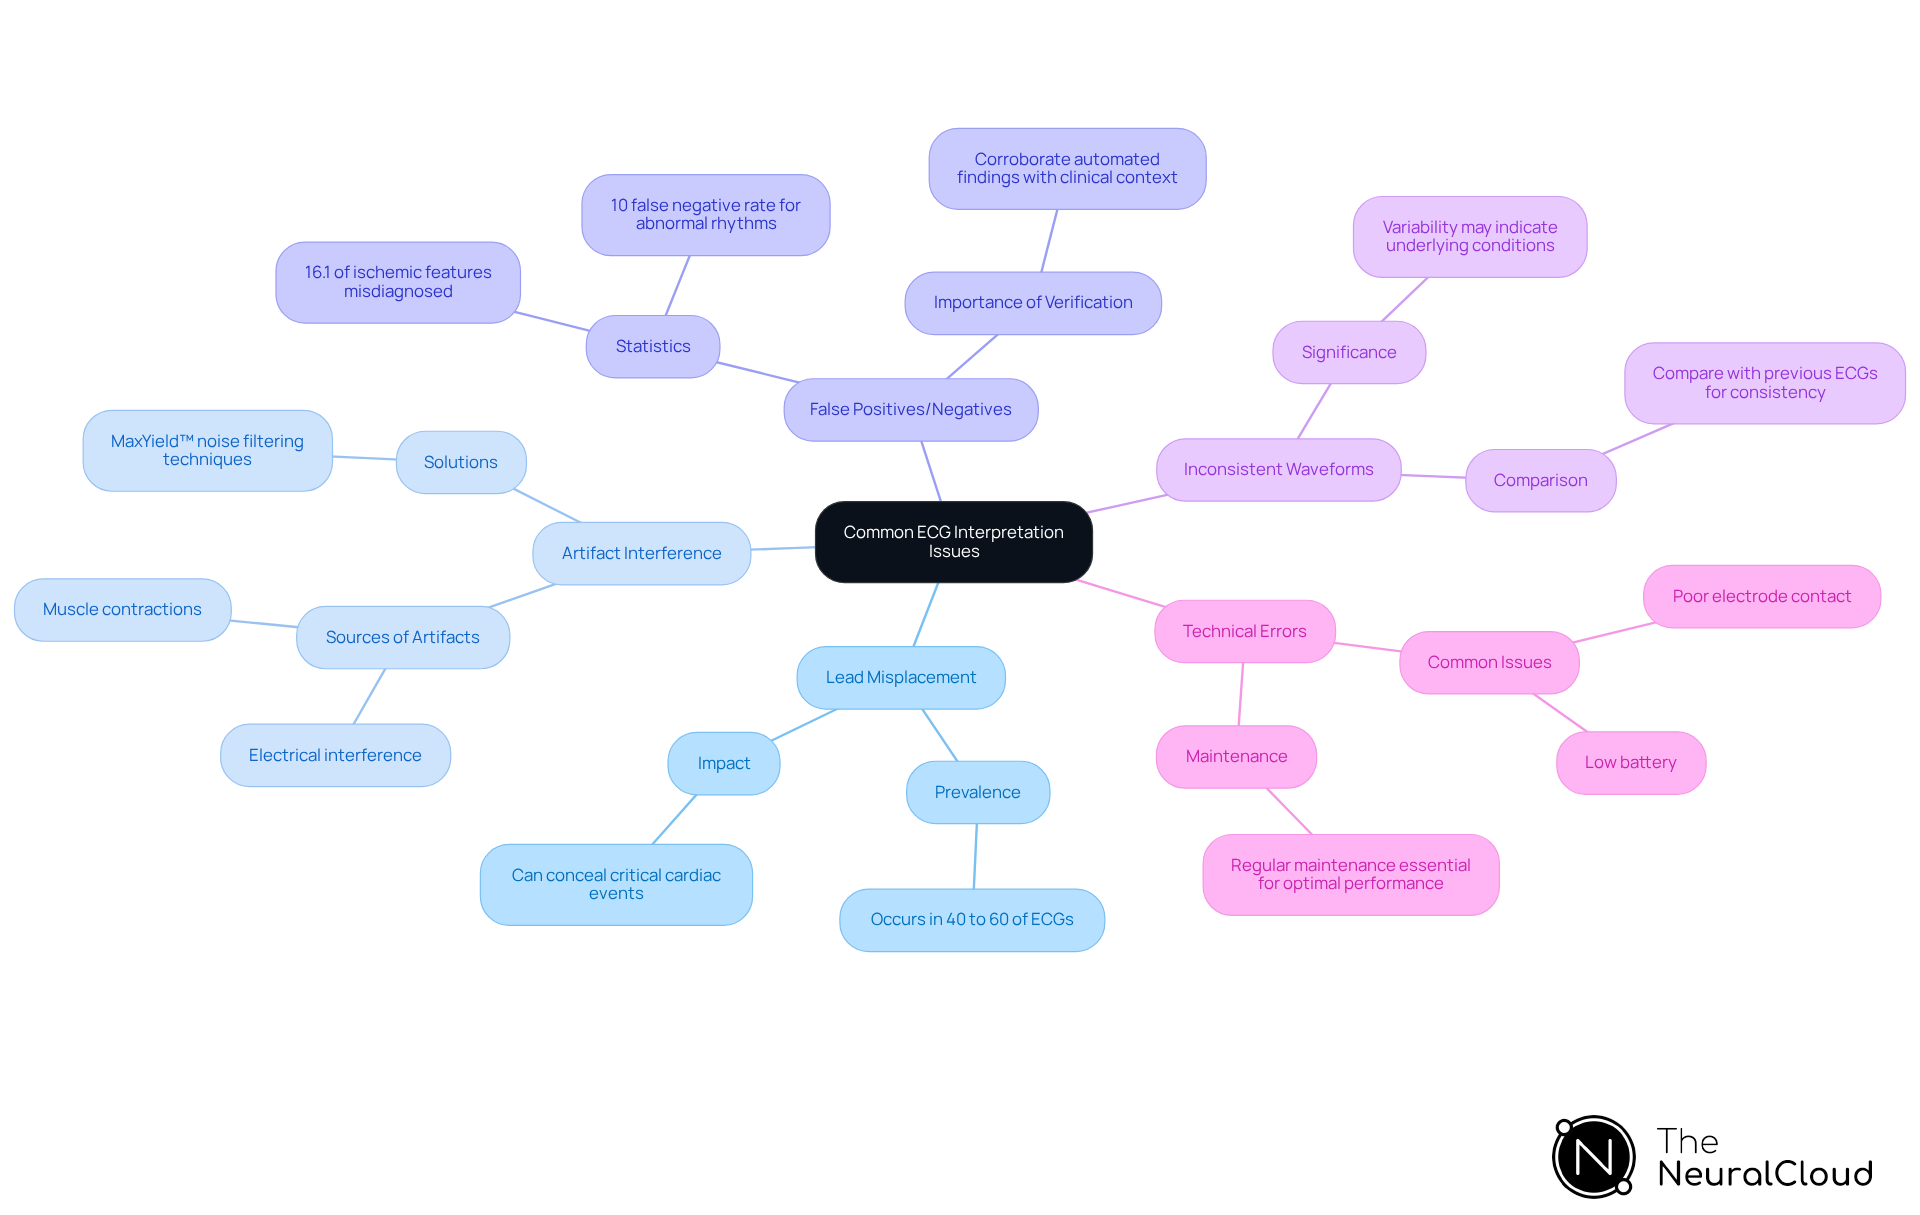
- Lead Misplacement: Incorrect lead placement can result in misinterpretation. Studies indicate that lead misplacement occurs in 40% to 60% of ECG acquisitions, potentially concealing critical cardiac events. Always verify lead positions on the ecg strip before analysis to mitigate these risks.
- Artifact Interference: Noise from muscle contractions or electrical interference can obscure true signals. Neural Cloud Solutions' MaxYield™ platform employs advanced noise filtering techniques to rapidly isolate ECG waves from recordings with high levels of noise and artifact. This significantly minimizes these effects and enhances signal clarity.
- False Positives/Negatives: Automated systems may misinterpret normal variants as pathologies. For instance, a study found that 16.1% of ischemic features were incorrectly diagnosed, emphasizing the importance of corroborating automated findings with clinical context.
- Inconsistent Waveforms: Variability in waveform morphology can indicate underlying conditions. It is essential to compare with previous ECGs for consistency, as discrepancies may signal significant health issues. MaxYield™ enhances waveform recognition for the ecg strip, allowing for clearer identification of true signals.
- Technical Errors: Issues such as poor electrode contact or low battery can affect signal quality. Regular maintenance of ECG machines is essential to ensure optimal performance.
For further troubleshooting tips, consider resources like and .

Conclusion
Mastering ECG strip analysis is an essential skill for healthcare professionals, as precise interpretation can greatly influence patient care. Understanding the fundamental components of the ECG waveform—namely the P Wave, QRS Wave, T Wave, and U Wave—enables professionals to enhance their diagnostic capabilities. This foundational knowledge assists in identifying abnormalities and underscores the necessity of systematic analysis for achieving accurate results.
The article presents a structured method for ECG strip analysis, detailing steps from evaluating heart rate and rhythm to assessing the ST segment and summarizing findings. Each step is designed to foster a comprehensive understanding of the ECG, empowering practitioners to diagnose conditions such as atrial fibrillation and ventricular hypertrophy more effectively. Additionally, it points out common pitfalls in ECG interpretation, including:
- Lead misplacement
- Artifact interference
While offering solutions to mitigate these issues through advanced tools like the MaxYield™ platform.
The MaxYield™ platform features intuitive tools that streamline ECG analysis, reducing the risk of errors and enhancing accuracy. By utilizing advanced algorithms and real-time feedback, healthcare professionals can significantly improve their interpretative skills. The advantages of this platform include:
- Increased diagnostic confidence
- Improved patient outcomes
Making it an invaluable resource in cardiac health management.
Ultimately, the importance of continuous education and practice in mastering ECG interpretation cannot be overstated. As healthcare providers pursue excellence in patient care, adopting systematic methodologies and leveraging technology will be crucial in overcoming challenges in ECG analysis. By prioritizing comprehensive training and utilizing innovative solutions, professionals can markedly enhance diagnostic accuracy and improve patient outcomes in cardiac health management.
Frequently Asked Questions
What is the significance of the P Wave in an ECG waveform?
The P Wave represents atrial depolarization, indicating the electrical activity that triggers atrial contraction. Accurately recognizing the P signal is crucial for diagnosing atrial abnormalities.
What does the QRS Wave represent in an ECG?
The QRS Wave reflects ventricular depolarization and is vital for understanding the heart's pumping action. It consists of three components: the Q component, R component, and S component, and helps identify conditions such as bundle branch blocks and ventricular hypertrophy.
What does the T Wave indicate in an ECG?
The T Wave indicates ventricular repolarization, showcasing the recovery phase of the ventricles after contraction. Irregularities in the T component can signal issues like ischemia or electrolyte imbalances.
What is the U Wave and its significance?
The U Wave, although occasionally present, has less understood significance. It may relate to the repolarization of the Purkinje fibers and can provide additional insights into cardiac health when analyzed alongside other components.
Why is understanding ECG components important for healthcare professionals?
Understanding these components is vital for interpreting the rhythm and identifying abnormalities in the ECG strip. Mastering these waveform components enhances diagnostic capabilities and ultimately improves patient outcomes.
How accurate are healthcare providers in reading ECGs?
A study revealed that healthcare providers accurately read ECGs only 56.4% of the time, highlighting the necessity for thorough training in ECG interpretation.


