Overview
This article delves into the mastery of elevated ST segment analysis through advanced ECG techniques, highlighting its crucial role in diagnosing acute myocardial infarction (AMI). It begins by addressing the challenges faced in ECG analysis, particularly the complexities involved in interpreting ST segment elevation.
Next, the article introduces the MaxYield™ platform, detailing its features that enhance diagnostic accuracy. This platform employs advanced technologies that streamline the ECG analysis process, making it easier for healthcare professionals to identify critical conditions.
The benefits of using the MaxYield™ platform are significant. By improving the accuracy of ECG interpretations, it directly supports healthcare providers in making timely and informed decisions regarding patient care. This not only enhances diagnostic confidence but also contributes to better patient outcomes.
In summary, mastering elevated ST segment analysis through advanced ECG techniques is vital for effective diagnosis of AMI. The MaxYield™ platform stands out as a powerful tool that addresses the challenges of ECG analysis, offering features that lead to improved accuracy and significant benefits for healthcare professionals.
Introduction
Understanding the complexities of the ST segment in electrocardiogram (ECG) analysis is essential for healthcare professionals, as it acts as a key indicator of cardiac health. Accurately interpreting ST segment elevation can facilitate timely interventions in critical situations, such as acute myocardial infarction. However, distinguishing between normal variations and significant abnormalities presents a challenge, particularly when complicating factors like bundle branch blocks or electrical pacing are present.
To address these challenges, advanced techniques and technologies are available that clinicians can leverage to enhance their diagnostic accuracy. The MaxYield™ platform stands out as a powerful tool in this regard. It offers features designed to improve ECG analysis, making it easier for healthcare professionals to interpret complex data accurately.
By utilizing the MaxYield™ platform, clinicians can benefit from improved diagnostic capabilities, leading to better patient outcomes. This platform not only streamlines the analysis process but also provides clear insights that can guide clinical decision-making. As healthcare continues to evolve, embracing such innovative solutions is crucial for enhancing the quality of care.
Define the ST Segment in ECG Analysis
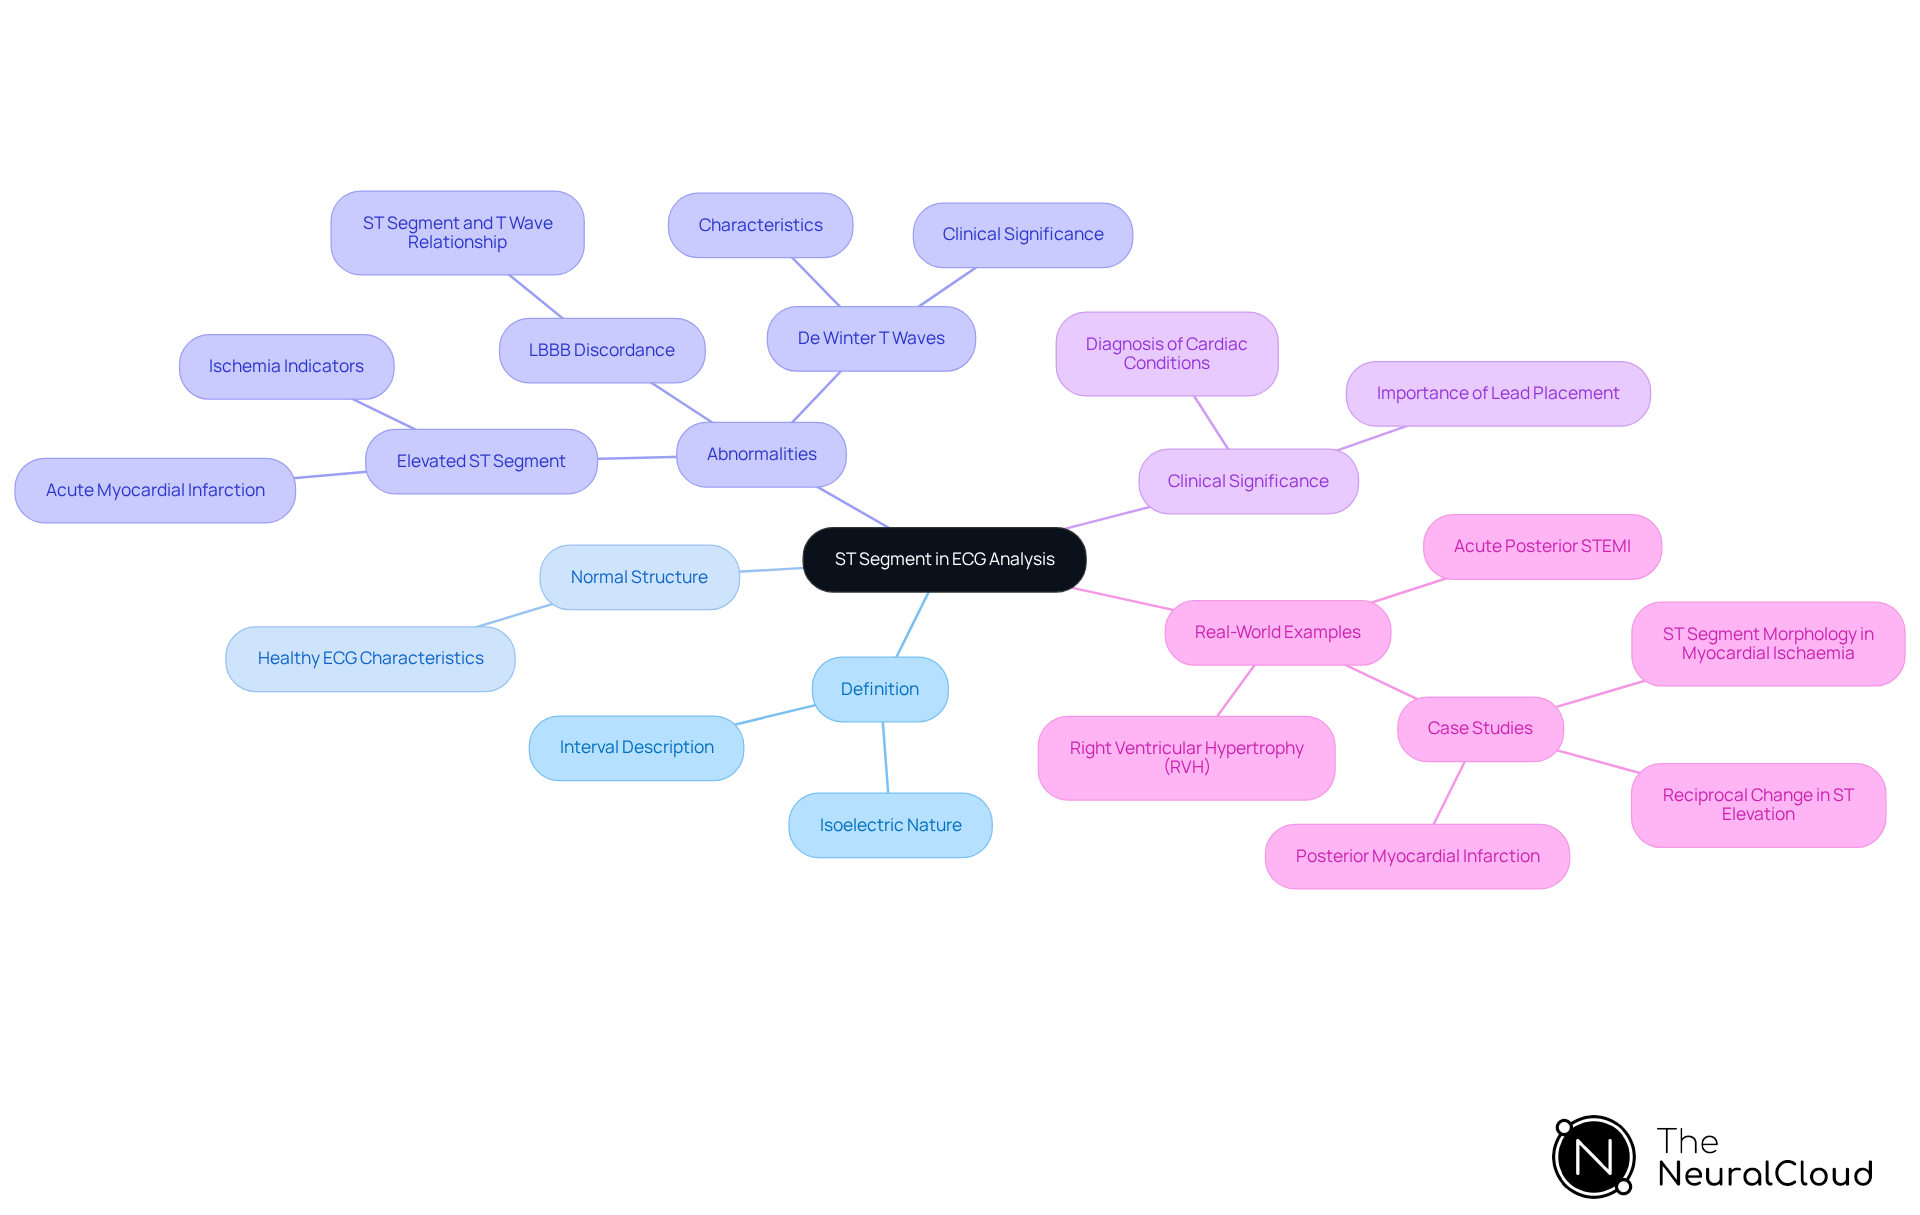
The ST portion is a crucial component of the electrocardiogram (ECG), representing the interval between the end of ventricular depolarization and the start of ventricular repolarization. It spans from the conclusion of the S wave to the beginning of the T wave. In a healthy ECG, this portion is isoelectric, resting on the baseline of the tracing. Deviations from this baseline, particularly an elevated ST segment, can indicate significant cardiac issues, such as ischemia or myocardial infarction.
Understanding the normal structure of the ST portion is vital for detecting irregularities that may necessitate further clinical evaluation. For instance, the elevated ST segment is a key indicator of acute myocardial infarction, appearing in adjacent leads with reciprocal ST depression in opposing leads. Recognizing this pattern, which may indicate an elevated ST segment, is essential for timely diagnosis and intervention.
Recent research underscores the frequent occurrence of elevated ST segment abnormalities in ECG readings. Conditions like left bundle branch block (LBBB) can create discordance between the ST interval and T wave, complicating interpretation. Additionally, specific patterns such as De Winter T waves, characterized by an elevated ST segment along with up-sloping ST depression and peaked T waves, are strongly indicative of acute left anterior descending (LAD) artery occlusion. This highlights the importance for clinicians to be skilled in identifying these variations.
Real-world examples further demonstrate the clinical significance of ST shape morphology. Right ventricular hypertrophy (RVH) is linked to ST depression and T-wave inversion in the right precordial leads, aiding in its diagnosis. Similarly, acute posterior STEMI presents with ST depression in anterior leads, underscoring the importance of lead placement in analyzing ST changes.
In conclusion, the ST portion is a critical marker of cardiac health. Its analysis is essential for accurate ECG interpretation and effective patient management.

Explore Clinical Significance of ST Segment Elevation
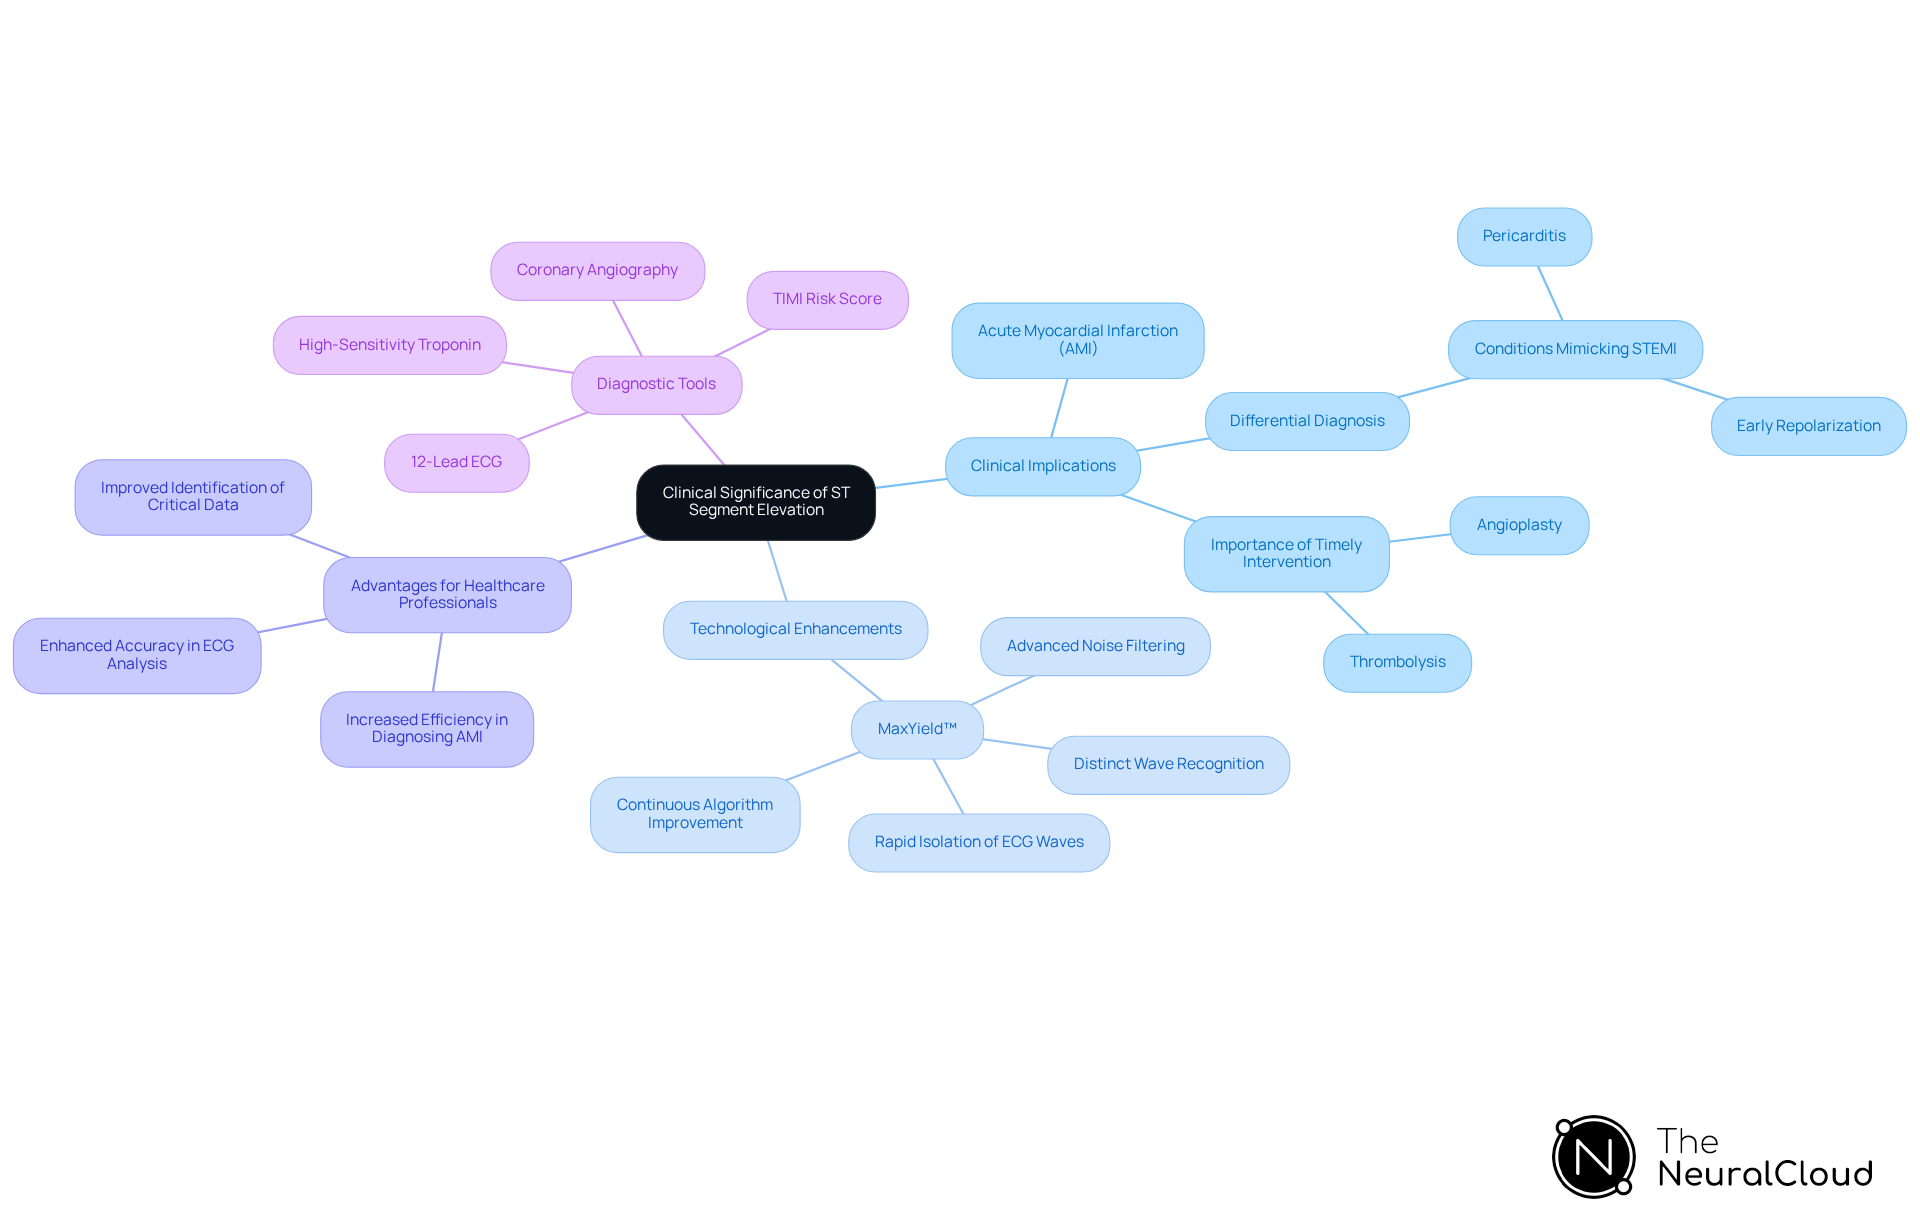
The presence of an elevated ST segment is a vital sign of acute myocardial infarction (AMI), indicating significant disturbances in the heart's electrical function due to ischemia from blocked blood flow. This increase is clinically quantified in millimeters above the baseline and can vary in both duration and morphology. Timely identification of the elevated ST segment alteration is crucial, as it can lead to swift interventions like angioplasty or thrombolysis, which are essential for improving patient outcomes. For example, studies show that prompt treatment can significantly reduce morbidity and mortality associated with STEMI, with over 800,000 heart attacks occurring annually in the United States, underscoring the urgency of effective diagnosis and intervention.
Differential diagnosis is essential, as conditions like pericarditis and early repolarization can also present with an elevated ST segment. Current guidelines emphasize the importance of a comprehensive clinical assessment, which includes evaluating lead concordance and elevated ST segment trends, particularly in patients with advanced pacing systems. A case study involving a 69-year-old male with a biventricular implantable cardioverter-defibrillator (BiV ICD) illustrated the challenges of interpreting ST waveform increases in paced rhythms. Despite these difficulties, coronary angiography revealed critical stenosis and an elevated ST segment, highlighting the need for vigilance in diagnosing AMI in patients with complex cardiac histories.
Neural Cloud Solutions' MaxYield™ platform enhances the efficiency of ECG analysis through advanced noise filtering and distinct wave recognition capabilities. This technology allows for the rapid isolation of ECG waves from recordings that may be compromised by baseline wander, movement, and muscle artifacts. By salvaging previously obscured sections of lengthy Holter, 1-Lead, and patch monitor recordings, MaxYield™ addresses the challenges of physiological variability and signal artifacts, ensuring that critical data is accurately identified and labeled. The algorithm evolves with each use, continuously improving its accuracy and efficiency, which is vital for maximizing diagnostic yield.
Features of MaxYield™:
- Advanced noise filtering
- Distinct wave recognition capabilities
- Rapid isolation of ECG waves
- Continuous algorithm improvement
Advantages for Healthcare Professionals:
- Enhanced accuracy in ECG analysis
- Improved identification of critical data
- Increased efficiency in diagnosing AMI
In summary, understanding the subtleties of ST changes and adhering to current diagnostic guidelines are vital for healthcare professionals to ensure prompt and effective treatment of AMI. Additionally, the TIMI risk score, which predicts the risk of death following STEMI based on eight risk factors, can assist in assessing patient risk and guiding treatment decisions. High-sensitivity troponin remains a primary biomarker for diagnosing myocardial infarction, further enriching the diagnostic toolkit available to clinicians.

Implement Step-by-Step ECG Interpretation Techniques
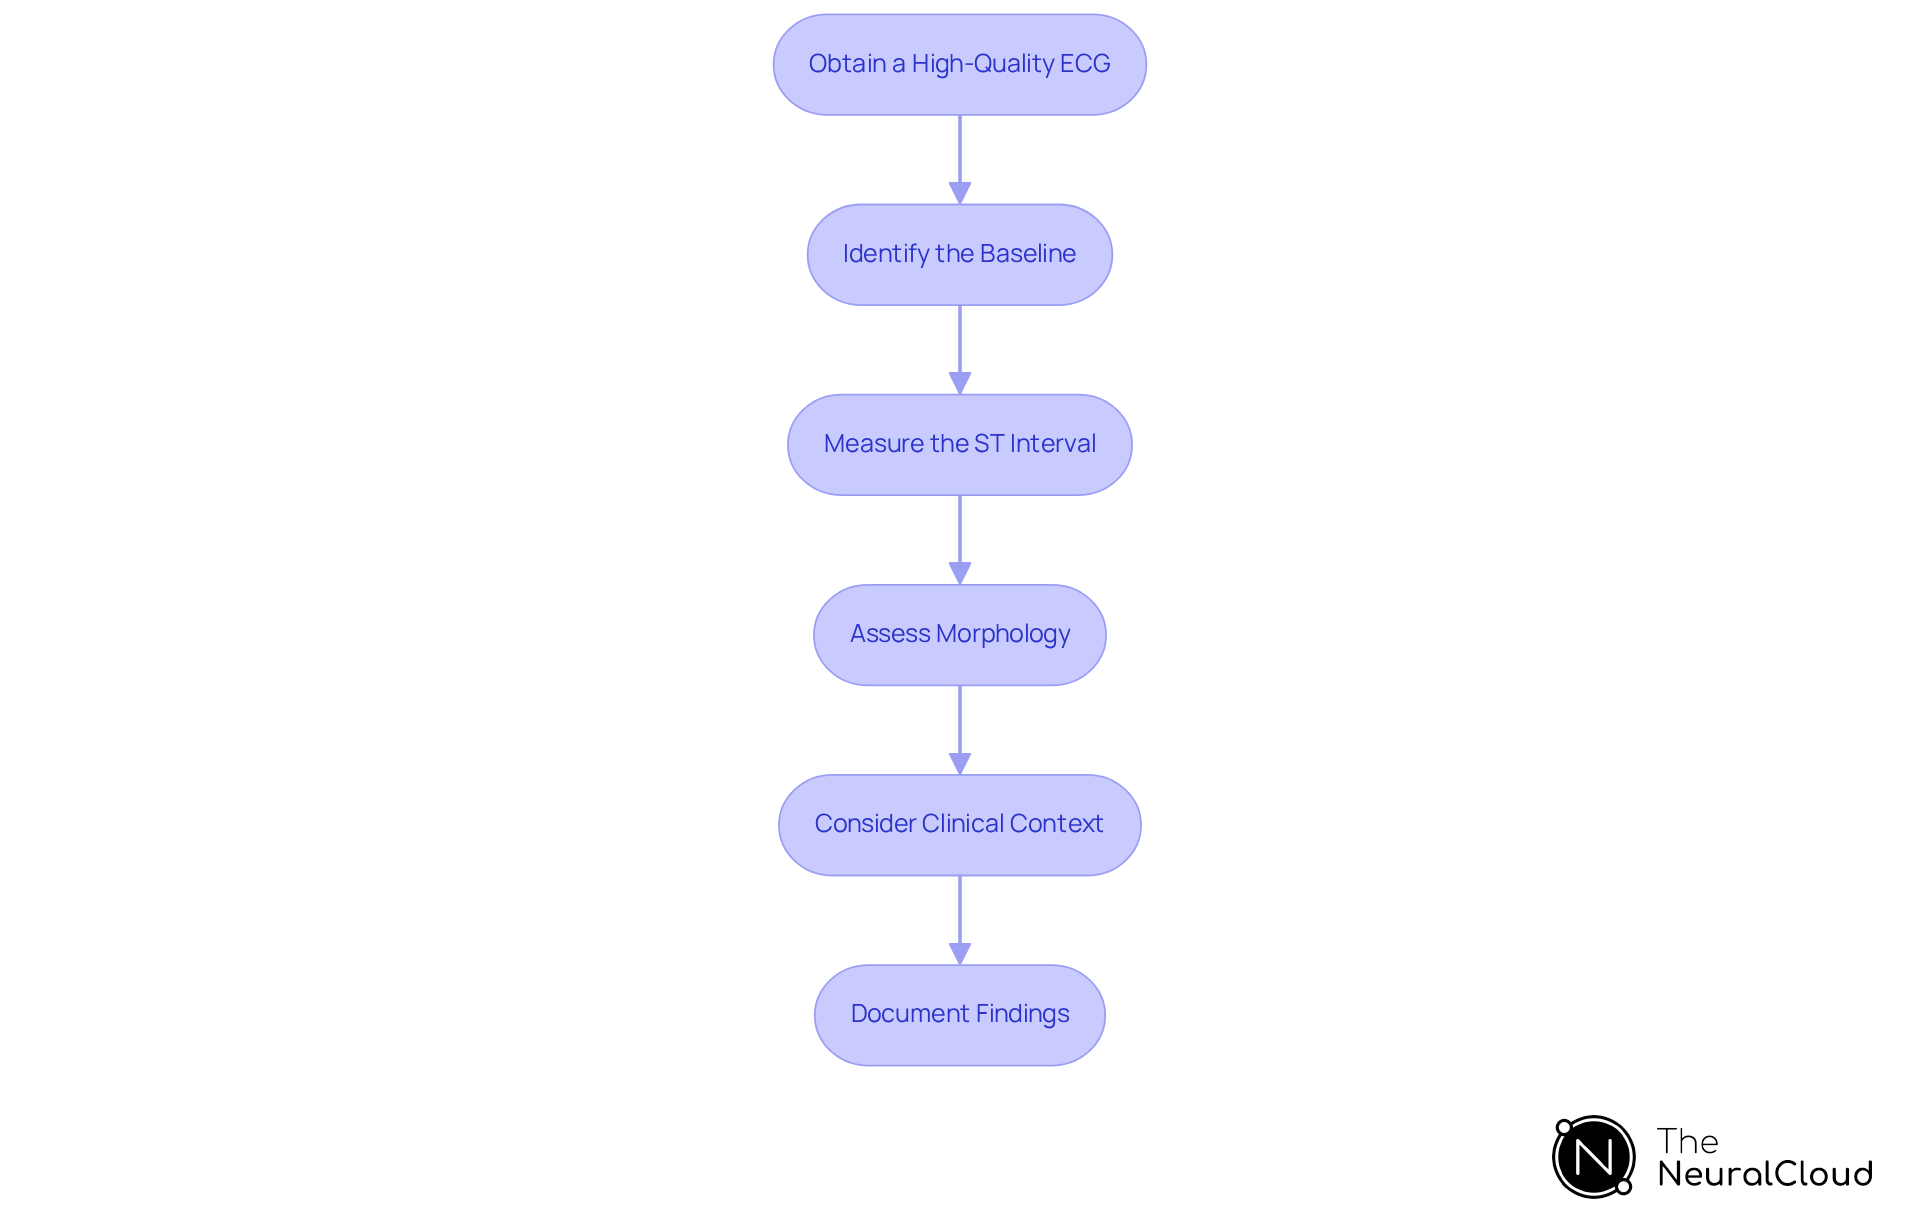
To effectively interpret the ST segment and identify elevation, follow these step-by-step techniques:
-
Obtain a High-Quality ECG: Ensure that the ECG is recorded with minimal noise and artifacts, as these can significantly impact analysis results. Utilizing Neural Cloud Solutions' MaxYield™ platform helps achieve this by employing advanced noise filtering and distinct wave recognition. This technology rapidly isolates ECG waves, even in recordings with high levels of noise and artifact. Studies indicate that artifacts can lead to misinterpretation, emphasizing the need for a clean signal.
-
Identify the Baseline: Locate the isoelectric line on the ECG tracing, which serves as the reference point for measuring ST change. Accurate baseline identification is crucial for reliable measurements.
-
Measure the ST Interval: Utilize calipers or digital tools to assess the height of the ST interval from the baseline to the point of rise. A rise of 1 mm or more in two or more contiguous limb leads or greater than 2 mm in two or more chest leads, indicative of an elevated ST segment, is typically considered significant for diagnosing conditions like myocardial infarction.
-
Assess Morphology: Evaluate the shape of the ST portion. Look for characteristics such as concavity or convexity, which can provide additional diagnostic clues. Morphological changes can indicate different underlying cardiac conditions.
-
Consider Clinical Context: Correlate the findings with the individual's clinical history and symptoms to determine the significance of the ST segment elevation. This holistic approach ensures that the interpretation is pertinent to the individual's overall health condition.
-
Document Findings: Record your observations and interpretations clearly, as this documentation is crucial for ongoing management and communication with other healthcare providers. Proper documentation practices enhance the continuity of care and facilitate collaborative decision-making.
Incorporating these best practices into your ECG analysis routine, especially with the aid of MaxYield™, can significantly improve diagnostic accuracy and patient outcomes. Continuous education and training in ECG interpretation are essential, as evidenced by studies showing that accuracy improves with experience and specialized training. Notably, 75.4% of GPs expressed interest in receiving online ECG interpretation training, highlighting the relevance of ongoing learning in this field, particularly in conjunction with the advanced capabilities of MaxYield™.

Utilize Advanced Technologies for Enhanced ECG Analysis
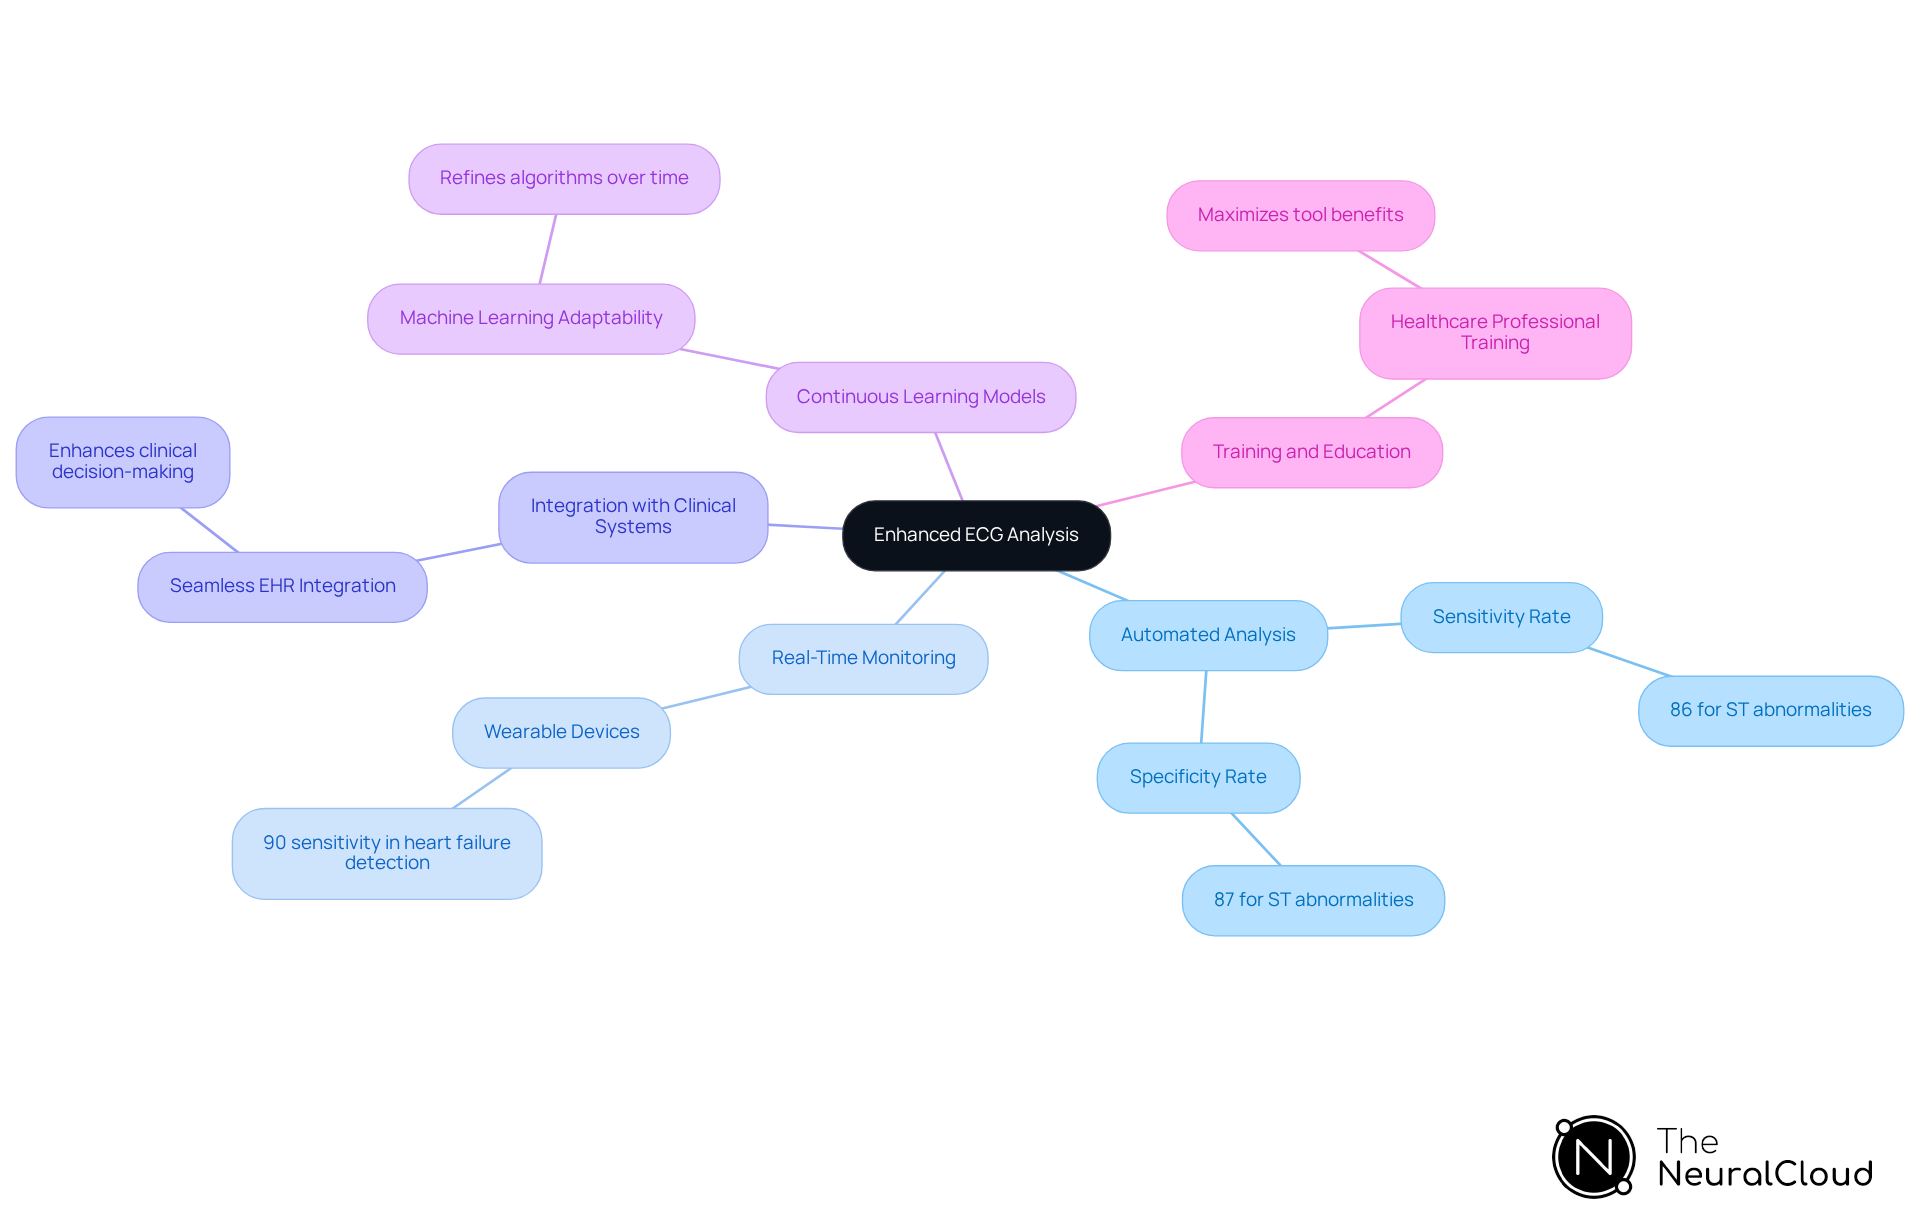
Cutting-edge technologies, particularly the MaxYield™ platform from Neural Cloud Solutions, are revolutionizing ECG analysis through the use of AI algorithms that automate the detection and labeling of ST abnormalities. This automation not only significantly reduces analysis time but also enhances diagnostic accuracy. Below are effective strategies for leveraging these technologies:
- Automated Analysis: The MaxYield™ platform automatically assesses ECG data, accurately identifying the elevated ST segment and other irregularities. Research indicates that AI algorithms can achieve sensitivity rates of up to 86% and specificity of 87% in detecting these conditions, ensuring maximum diagnostic yield.
- Real-Time Monitoring: Wearable devices that continuously monitor ECG signals enable immediate detection of elevated ST segment changes in high-risk individuals. For example, AI-enabled smartwatches have shown a 90% sensitivity in detecting heart failure, highlighting their potential for real-time applications.
- Integration with Clinical Systems: Seamless integration of ECG analysis platforms with electronic health records (EHR) allows for easy access to individual data, enhancing clinical decision-making. This integration streamlines workflows, enabling healthcare professionals to focus on essential patient care.
- Continuous Learning Models: Systems like MaxYield™ utilize machine learning to refine their algorithms over time. This adaptability ensures that the analysis remains accurate and relevant as new data emerges, ultimately improving diagnostic yield.
- Training and Education: Comprehensive training for healthcare professionals on interpreting results from advanced ECG analysis technologies is crucial. This education maximizes the benefits of these tools in clinical practice, ensuring clinicians can make informed decisions based on reliable data.
As noted by Manuel Martínez-Sellés, AI algorithms can assist clinicians in interpreting and detecting ECG abnormalities, further validating the advantages of these advanced technologies. By implementing these strategies, healthcare providers can significantly enhance their ECG analysis capabilities, leading to improved patient outcomes and more efficient clinical workflows.

Conclusion
The analysis of the ST segment in electrocardiograms (ECGs) is crucial for understanding cardiac health, especially in diagnosing conditions like myocardial infarction. By mastering the nuances of ST segment elevation, healthcare professionals can significantly enhance their diagnostic capabilities and improve patient outcomes. Recognizing the importance of this segment not only aids in timely interventions but also highlights the need for continuous education and the integration of advanced technologies in clinical practice.
Key insights from the article underscore the critical role of the ST segment in identifying various cardiac abnormalities, including acute myocardial infarction and related conditions. Advanced techniques, such as the MaxYield™ platform for precise ECG analysis, demonstrate how technology can streamline the interpretation process and enhance diagnostic accuracy. The step-by-step guide provided offers a practical approach for clinicians to effectively assess ST segment changes, ensuring a thorough understanding of the underlying cardiac issues.
The significance of advanced ECG analysis cannot be overstated. By embracing innovative technologies and refining interpretation skills, healthcare professionals are better equipped to respond to cardiac emergencies. The urgency of accurate ST segment analysis in clinical settings serves as a call to action for ongoing training and the adoption of cutting-edge tools, ultimately leading to improved patient care and outcomes in cardiology.
Frequently Asked Questions
What does the ST segment represent in an ECG?
The ST segment represents the interval between the end of ventricular depolarization and the start of ventricular repolarization, spanning from the conclusion of the S wave to the beginning of the T wave.
What is the normal appearance of the ST segment in a healthy ECG?
In a healthy ECG, the ST segment is isoelectric, resting on the baseline of the tracing.
What can deviations from the baseline of the ST segment indicate?
Deviations, particularly an elevated ST segment, can indicate significant cardiac issues such as ischemia or myocardial infarction.
Why is it important to understand the normal structure of the ST segment?
Understanding the normal structure is vital for detecting irregularities that may require further clinical evaluation.
What is a key indicator of acute myocardial infarction in ECG readings?
An elevated ST segment appearing in adjacent leads with reciprocal ST depression in opposing leads is a key indicator of acute myocardial infarction.
What complications can arise from conditions like left bundle branch block (LBBB)?
LBBB can create discordance between the ST interval and T wave, complicating the interpretation of ECG readings.
What are De Winter T waves, and what do they indicate?
De Winter T waves are characterized by an elevated ST segment along with up-sloping ST depression and peaked T waves, strongly indicating acute left anterior descending (LAD) artery occlusion.
How can ST segment morphology assist in diagnosing conditions like right ventricular hypertrophy (RVH)?
RVH is linked to ST depression and T-wave inversion in the right precordial leads, aiding in its diagnosis.
What does ST depression in anterior leads indicate in the context of acute posterior STEMI?
ST depression in anterior leads can indicate acute posterior STEMI, highlighting the importance of lead placement in analyzing ST changes.
Why is the analysis of the ST segment critical in ECG interpretation?
The analysis of the ST segment is critical for accurate ECG interpretation and effective patient management, as it serves as a marker of cardiac health.


