Introduction
Understanding the intricacies of T waves in electrocardiograms (ECGs) is essential for healthcare professionals, as these waves significantly influence the assessment of cardiac health. Elevated T waves, often indicative of underlying conditions such as hyperkalemia or myocardial ischemia, provide vital insights into a patient's heart status. However, accurately interpreting these signals amidst the complexities of ECG readings presents a challenge. Clinicians must effectively master the analysis of elevated T waves to enhance diagnostic accuracy and improve patient outcomes.
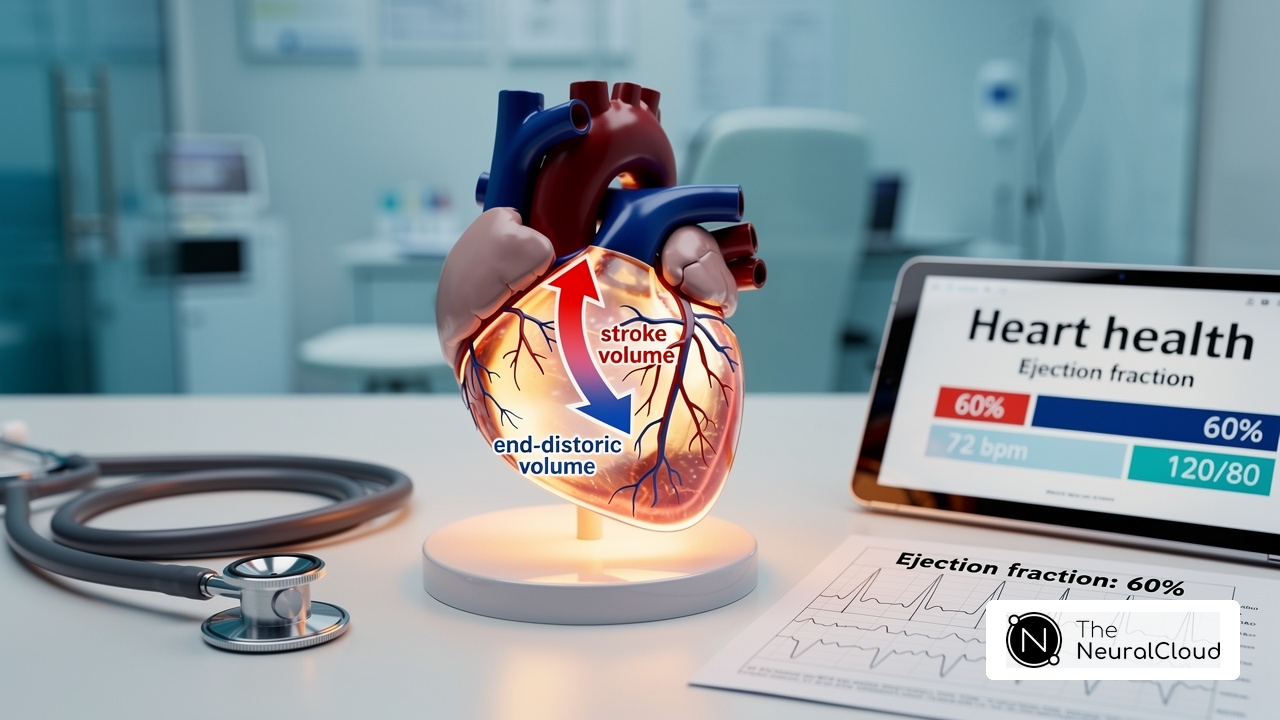
Define the T Wave: Characteristics and Importance in ECG
The T component is a vital element of the electrocardiogram (ECG), signifying the repolarization of the ventricles following contraction. It typically appears as a smooth, rounded oscillation after the QRS complex. Key characteristics include:
- Normal Amplitude: In most leads, T waves should be upright, with an amplitude generally less than 10 mm in men and 8 mm in women.
- Morphology: Normal T waves are typically asymmetrical, featuring a gradual ascent followed by a more rapid descent.
- Clinical Significance: Abnormalities in T waves can signal various cardiac conditions. For instance, tall, peaked T waves may suggest hyperkalemia, while inverted T waves are frequently linked to myocardial ischemia, which may be represented as an abnormality. T inversion (TWI) was recorded in 120 out of 5,360 cases, with 13% of those identified with cardiomyopathy. Patients with more pronounced T deflections (>0.183 mV) were found to be 18 times more likely to receive a cardiomyopathy diagnosis. Changes in T waves, particularly changes in morphology, impacting various regions of the heart were seven times more likely to signify underlying disease, emphasizing the significance of T wave analysis in ECG interpretation. As Dr. Finocchiar noted, ECGs can identify indications of heart disease that might remain overlooked, providing standards to distinguish between benign and harmful conditions, including the risk of arrhythmias.
Integrating Neural Cloud Solutions' technology can significantly improve the assessment of T waves. MaxYield™ utilizes advanced algorithms and unique signal recognition to isolate and label critical data, even in recordings with high levels of noise and artifact. This capability enables a more accurate analysis, aiding in the detection of irregularities that might otherwise be hidden. MaxYield™ also delivers beat-by-beat analysis, processing 200,000 heartbeats in less than 5 minutes, which is crucial for timely diagnosis. Comprehending these traits is crucial for clinicians, as T wave abnormalities can act as early signs of serious heart problems.

Explore Physiological Mechanisms of Elevated T Waves
Raised T patterns can originate from various physiological mechanisms, frequently indicating underlying heart or systemic conditions. Key factors include:
- Hyperkalemia can lead to cardiac arrhythmias. Recognizing this condition is critical, as it can indicate severe electrolyte imbalance.
- Myocardial infarction: In the early stages of myocardial infarction, T deflections may become hyperacute, signaling significant cardiac distress.
- Intracranial pressure: Conditions that raise intracranial pressure can also present as elevated T waves, particularly in the context of brain injury.
- Vagal Tone: An increase in vagal tone can result from relaxation, especially in athletes or during sleep.
Comprehending these mechanisms is crucial for clinicians to recognize the possible reasons for elevated T wave signals and to carry out suitable interventions.

Implement ECG Interpretation Techniques for Elevated T Waves
To effectively interpret T waves on an ECG, clinicians can employ several key techniques:
- Systematic Analysis: Begin by reviewing the entire ECG for context. Evaluate the T deflection in relation to the preceding QRS complex and ST segment, as this offers critical insights.
- Lead Comparison: Assess the T wave morphology. Elevated T deflections in leads V2-V3 may signify localized ischemia, while extensive alterations could imply systemic concerns like hyperkalemia, where potassium levels are elevated, resulting in typical narrow, peaked T-deflections.
- Clinical Correlation: Always relate T wave findings to the patient's clinical history and symptoms. Elevated T wave patterns in a patient presenting with chest discomfort may require urgent intervention, as they can indicate myocardial infarction.
- Utilize Technology: Leverage advanced software, such as the MaxYield™ platform. This platform automates the identification and labeling of T wave abnormalities, rapidly analyzing ECG signals and delivering beat-by-beat analysis. It outputs data in CSV format for easy integration into existing workflows. This technology enhances diagnostic efficiency by filtering noise and artifacts, allowing for clearer signal interpretation and improving the accuracy of detecting critical conditions.
By mastering these interpretation techniques and utilizing the capabilities of MaxYield™, healthcare professionals can significantly improve diagnosis and respond to critical cardiac conditions associated with elevated T waves. Ultimately, this enhances patient outcomes.

Conclusion
Understanding elevated T waves is crucial for accurate ECG analysis, as they can serve as vital indicators of underlying cardiac issues. This article explores the characteristics of T waves, their physiological mechanisms, and essential interpretation techniques. Recognizing abnormalities is emphasized to enhance patient care.
Key insights include the significance of T wave morphology, which can reveal conditions such as hyperkalemia and myocardial ischemia. Advanced tools, like Neural Cloud Solutions' MaxYield™ platform, improve the ability to detect and analyze T wave irregularities. This platform provides clinicians with the necessary tools to make timely decisions in critical situations.
Ultimately, mastering the analysis of elevated T waves not only improves diagnostic accuracy but also has the potential to significantly impact patient outcomes. By prioritizing ECG interpretation techniques and leveraging innovative technology, healthcare professionals can better identify and manage cardiac conditions, ensuring that no potential warning signs are overlooked.
Frequently Asked Questions
What does the T wave signify in an ECG?
The T wave represents the repolarization of the ventricles following contraction in an electrocardiogram (ECG).
What are the key characteristics of a normal T wave?
A normal T wave typically appears as a smooth, rounded oscillation after the QRS complex, is upright in most leads, has an amplitude generally less than 10 mm in men and 8 mm in women, and features asymmetrical morphology with a gradual ascent followed by a more rapid descent.
Why is the morphology of the T wave clinically significant?
Abnormalities in T wave morphology can indicate various cardiac conditions. For example, tall, peaked T waves may suggest hyperkalemia, while inverted T waves are often linked to myocardial ischemia.
What is the prevalence of T wave inversion (TWI) in patients with cardiomyopathy?
T wave inversion was recorded in 120 out of 5,360 cases, with 13% of those patients identified with cardiomyopathy.
How does the amplitude of T wave deflections relate to cardiomyopathy diagnosis?
Patients with more pronounced T wave deflections greater than 0.183 mV were found to be 18 times more likely to receive a cardiomyopathy diagnosis.
What is the significance of elevated T wave changes in ECG analysis?
Elevated T wave changes impacting various regions of the heart were seven times more likely to signify underlying disease, highlighting the importance of T wave analysis in detecting potential cardiac problems.
How can the MaxYield™ platform improve the assessment of T wave abnormalities?
The MaxYield™ platform utilizes advanced noise filtering and unique signal recognition to isolate and label critical data in ECG recordings, enabling more precise interpretation of T signals even in noisy environments.
What is the processing capability of the MaxYield™ platform?
MaxYield™ delivers beat-by-beat analysis, processing 200,000 heartbeats in less than 5 minutes, which is essential for timely clinical decision-making.
Why is understanding T wave characteristics important for ECG analysis?
Comprehending T wave characteristics is crucial for accurate ECG analysis, as T wave abnormalities can serve as early indicators of serious heart problems.
List of Sources
- Define the T Wave: Characteristics and Importance in ECG
- ECG T Wave Inversion Features Predict Cardiomyopathy | www.PhysiciansWeekly.com (https://physiciansweekly.com/post/ecg-t-wave-inversion-features-predict-cardiomyopathy)
- rheumatologyadvisor.com (https://rheumatologyadvisor.com/news/st-t-t-wave-changes-most-common-ecg-abnormalities-sle-lupus)
- T wave (https://litfl.com/t-wave-ecg-library)
- Explore Physiological Mechanisms of Elevated T Waves
- Hyperkalaemia (https://litfl.com/hyperkalaemia-ecg-library)
- ECG T Wave - StatPearls - NCBI Bookshelf (https://ncbi.nlm.nih.gov/books/NBK538264)
- powerfulmedical.com (https://powerfulmedical.com/blog/hyperkalemia-ecg-critical-changes)
- docwirenews.com (https://docwirenews.com/post/changes-in-ecg-in-acute-versus-chronic-hyperkalemia)
- pmc.ncbi.nlm.nih.gov (https://pmc.ncbi.nlm.nih.gov/articles/PMC7617800)
- Implement ECG Interpretation Techniques for Elevated T Waves
- ahajournals.org (https://ahajournals.org/doi/10.1161/circep.113.001622)
- theneuralcloud.com (https://theneuralcloud.com/post/master-peaked-t-waves-essential-ecg-analysis-techniques)
- powerfulmedical.com (https://powerfulmedical.com/blog/hyperacute-t-waves)
- ahajournals.org (https://ahajournals.org/doi/10.1161/hc0902.104598)
- rheumatologyadvisor.com (https://rheumatologyadvisor.com/news/st-t-t-wave-changes-most-common-ecg-abnormalities-sle-lupus)