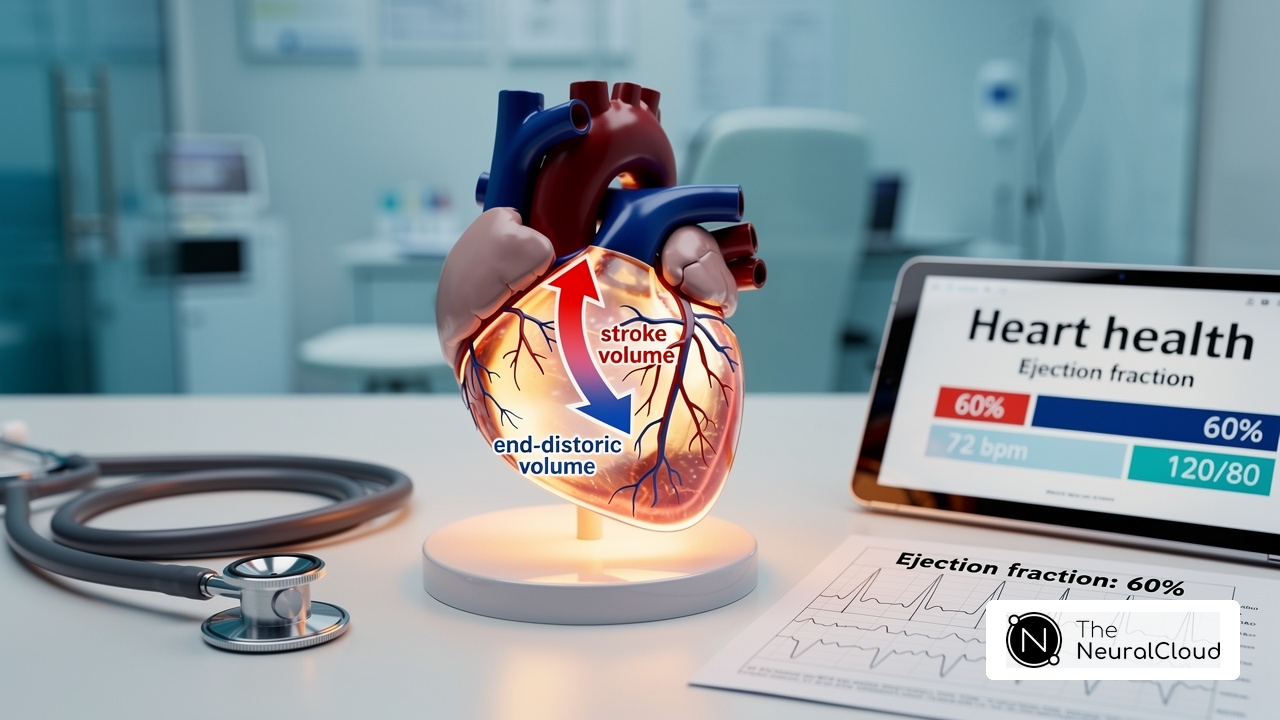
Introduction
Recognizing the subtle yet critical patterns of Wellens Syndrome on an electrocardiogram (ECG) can be the difference between timely intervention and a catastrophic cardiac event. This condition, marked by distinctive T-wave changes, signals significant narrowing of the left anterior descending artery and poses a high risk for myocardial infarction if overlooked.
As healthcare technology evolves, the integration of advanced ECG analysis tools like MaxYield™ streamlines the identification of these patterns and enhances overall diagnostic accuracy. Healthcare professionals can leverage these innovations to improve patient outcomes while navigating the complexities of ECG interpretation.
Define Wellens Syndrome: Clinical Significance and ECG Characteristics
This condition is a clinical state marked by distinct electrocardiographic (ECG) alterations, particularly characterized by biphasic or significantly inverted T waves in leads V2 and V3, which are associated with myocardial ischemia. These changes are often observed in patients who have experienced recent chest pain that has since resolved. The clinical significance of this condition lies in its association with critical narrowing of the left anterior descending (LAD) artery, indicating a high risk of subsequent myocardial infarction if not promptly addressed. Recognizing these patterns, particularly those seen in Wellens Syndrome, is vital for diagnosis and management of patients at risk of acute coronary syndromes (ACS).
The software from Neural Cloud Solutions addresses the challenges inherent in ECG interpretation. It enhances efficiency by utilizing advanced algorithms and distinct wave recognition. MaxYield™ rapidly isolates ECG waves from recordings affected by baseline wander, movement, and muscle artifacts, ensuring that critical data is accurately identified and labeled. This capability is essential for healthcare professionals who rely on accurate ECG analysis for effective patient management.
Moreover, MaxYield™ salvages previously obscured sections of lengthy Holter, 1-Lead, and patch monitor recordings. This addresses the challenges posed by physiological variability and signal artifacts, thereby improving the overall diagnostic process. By integrating this platform into their workflows, healthcare providers can enhance their diagnostic capabilities, leading to better patient outcomes.
In summary, the software serves as a crucial instrument for identifying ECG patterns, including those linked to significant clinical conditions. Its advanced features not only streamline the diagnostic process but also empower healthcare professionals to make timely, informed decisions in patient care.

Identify Wellens Syndrome ECG Patterns: Key Features and Interpretation
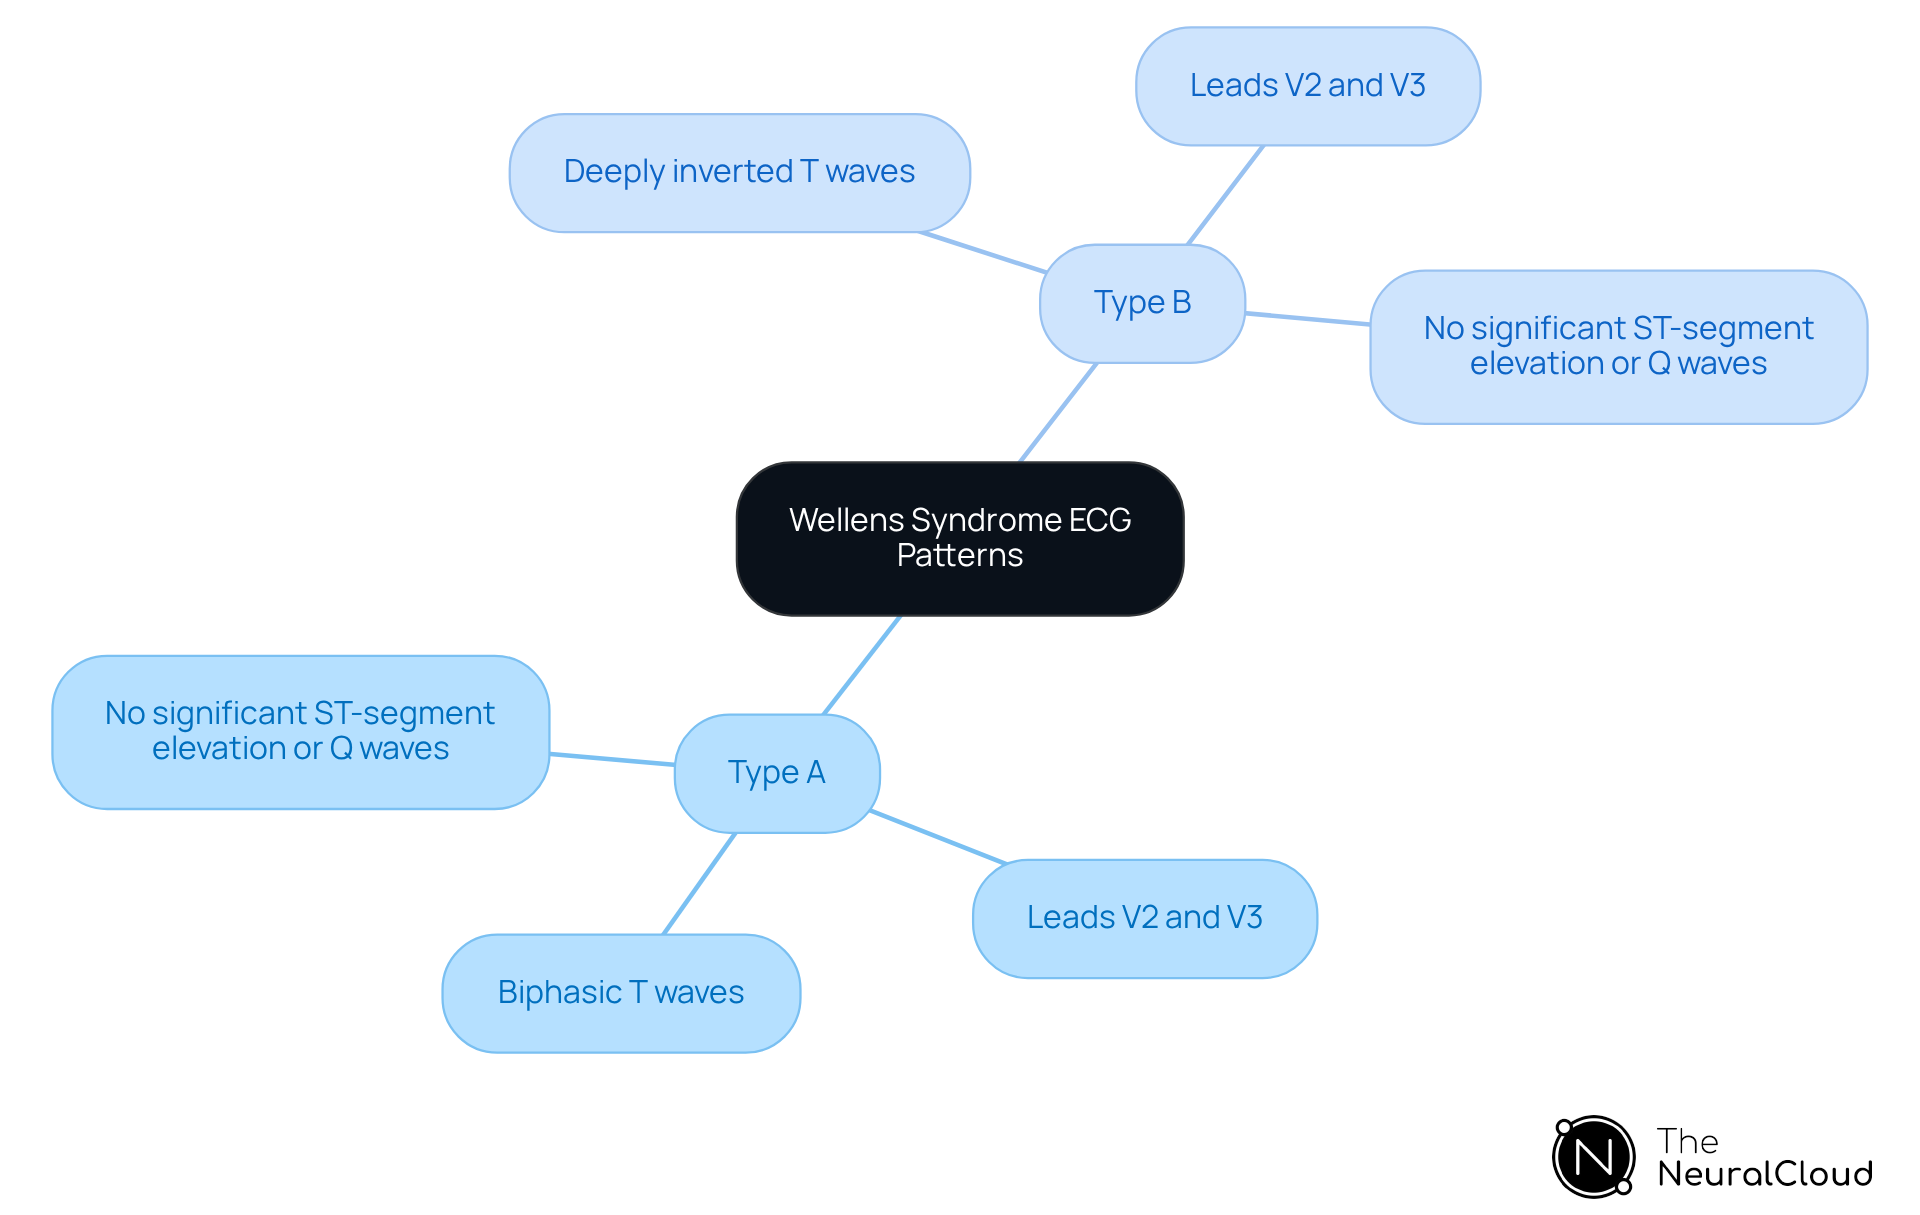
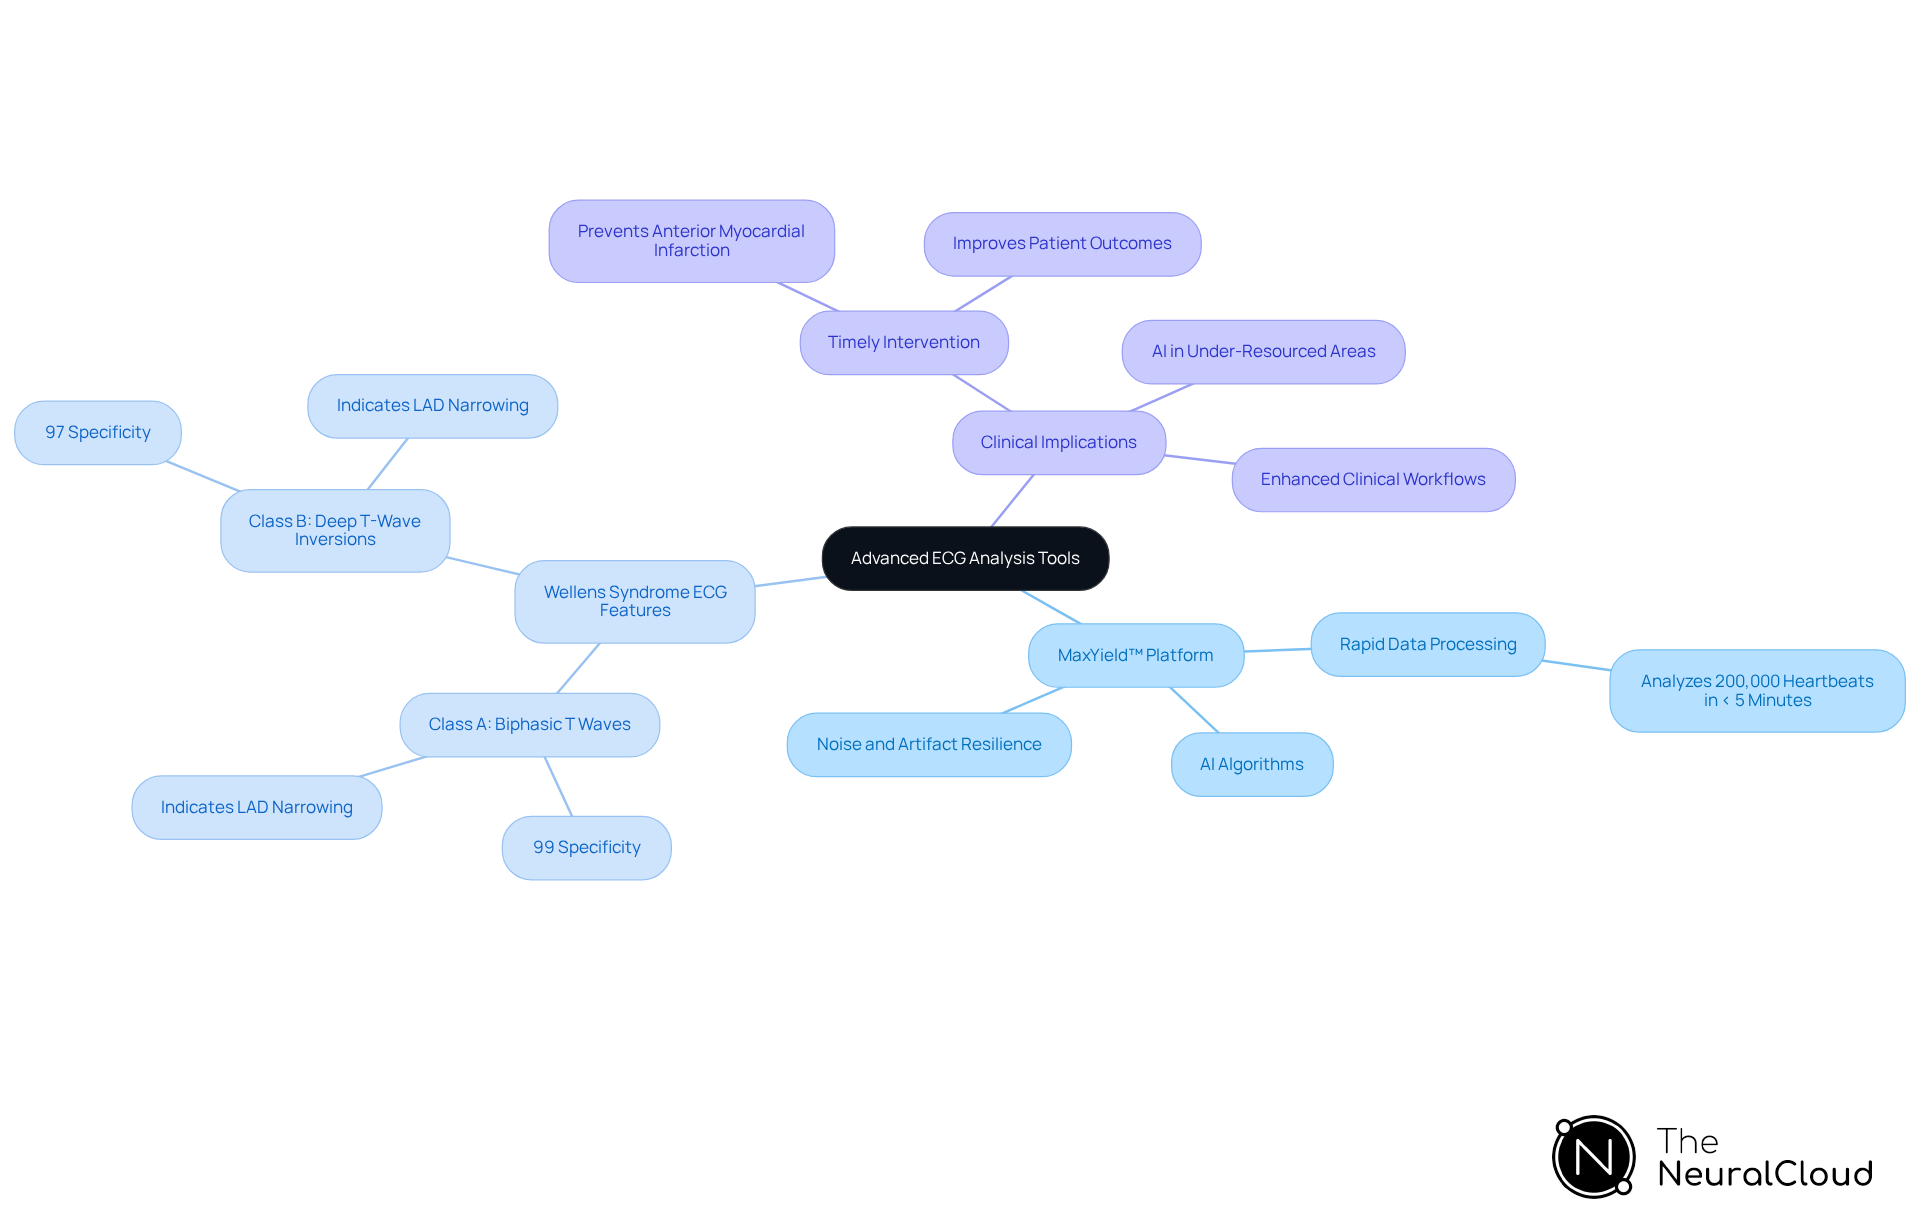
The patterns associated with Wellens Syndrome are classified into two primary types: A and B. Type A features biphasic T waves observed in leads V2 and V3. In contrast, Type B is characterized by deeply inverted T waves in the same leads. Both types manifest without significant ST-segment elevation or Q waves, which aids in distinguishing them from other cardiac conditions.
Understanding these patterns is essential, as they indicate a high likelihood of critical coronary artery stenosis, which can be detected through ECG analysis. This necessitates timely intervention to avert the risk of myocardial infarction.
Utilize Advanced ECG Analysis Tools: Enhancing Diagnosis of Wellens Syndrome
Advanced ECG analysis tools, such as the software from Neural Cloud Solutions, significantly enhance the diagnosis of cardiac conditions by utilizing algorithms to automate the identification and labeling of ECG features. This technology facilitates the analysis process, capable of analyzing over 200,000 heartbeats in under five minutes. Such efficiency is crucial, as the prompt identification of conditions can prevent severe complications, including anterior myocardial infarction.
The system excels in isolating key features, including T wave abnormalities, even in recordings impacted by noise and artifact. This condition is characterized by specific patterns, with:
- Class A exhibiting biphasic T waves
- Class B displaying deep T wave inversions
Both indicate Wellens Syndrome. The high specificity of these patterns—99% for Type A and 97% for Type B—emphasizes the critical role of accurate diagnosis in clinical practice.
Integrating AI-driven tools into clinical workflows not only enhances diagnostic accuracy but also reduces the time healthcare professionals dedicate to manual analysis. This efficiency is essential in managing the increasing demands of data and patient expectations on clinicians. Furthermore, studies show that patients with Wellens Syndrome who receive timely intervention, underscoring the necessity for tools like MaxYield™.
Healthcare professionals employing AI in ECG analysis have reported improved diagnostic outcomes and improved patient care. As technologies continue to advance, they possess the potential to further reduce interpretation inaccuracies, particularly in under-resourced areas, thereby enhancing overall healthcare delivery.
Conclusion
Understanding Wellens Syndrome and its distinctive ECG patterns is crucial for timely diagnosis and intervention in patients at risk of serious cardiac events. This condition, characterized by specific T wave changes, serves as a critical indicator of significant left anterior descending artery stenosis. Recognizing these patterns—Type A and Type B—can empower healthcare professionals to act swiftly, potentially averting myocardial infarction.
The article delves into the clinical significance of Wellens Syndrome, emphasizing how advanced tools like the MaxYield™ platform enhance ECG analysis. The MaxYield™ platform automates the identification of key patterns, improving diagnostic accuracy. By streamlining workflows, these technologies enable clinicians to manage patient care more effectively and ensure crucial ECG features are not overlooked, ultimately improving patient outcomes.
In light of the advancements in ECG analysis and the importance of identifying Wellens Syndrome, healthcare providers are encouraged to adopt these innovative tools. Embracing technology in clinical practice enhances diagnostic capabilities and supports the overarching goal of delivering high-quality patient care. As research continues to evolve, staying informed about the latest techniques and tools will be vital for effectively managing this critical cardiac condition.
Frequently Asked Questions
What is Wellens Syndrome?
Wellens Syndrome is a clinical condition characterized by specific electrocardiographic (ECG) changes, particularly biphasic or significantly inverted T waves in leads V2 and V3. It is commonly seen in patients who have experienced recent chest pain that has since resolved.
Why is Wellens Syndrome clinically significant?
The clinical significance of Wellens Syndrome lies in its association with critical narrowing of the left anterior descending (LAD) artery, which indicates a high risk of subsequent myocardial infarction if not addressed promptly.
How can Wellens Syndrome be recognized?
Wellens Syndrome can be recognized by observing the distinct ECG patterns, particularly the biphasic or significantly inverted T waves in leads V2 and V3, which are crucial for timely intervention and management of patients at risk of acute coronary syndromes (ACS).
What is the MaxYield™ platform and its relevance to ECG analysis?
The MaxYield™ platform from Neural Cloud Solutions enhances ECG analysis by utilizing advanced noise filtering and distinct wave recognition. It rapidly isolates ECG waves from recordings affected by baseline wander, movement, and muscle artifacts, ensuring accurate identification and labeling of critical data.
How does MaxYield™ improve diagnostic capabilities?
MaxYield™ improves diagnostic capabilities by salvaging previously obscured sections of lengthy Holter, 1-Lead, and patch monitor recordings, addressing challenges posed by physiological variability and signal artifacts. This leads to better diagnostic yield and improved patient outcomes.
What role does MaxYield™ play in identifying Wellens Syndrome?
MaxYield™ serves as a crucial instrument for identifying ECG patterns linked to Wellens Syndrome, streamlining ECG analysis and empowering healthcare professionals to make timely, informed decisions in patient care.
List of Sources
- Utilize Advanced ECG Analysis Tools: Enhancing Diagnosis of Wellens Syndrome
- mdpi.com (https://mdpi.com/2673-3846/2/4/505)
- acc.org (https://acc.org/Latest-in-Cardiology/ten-points-to-remember/2023/01/20/17/59/wellens-syndrome)
- mayoclinicproceedings.org (https://mayoclinicproceedings.org/article/S0025-6196(11)62192-7/fulltext)