Introduction
Understanding the intricacies of an electrocardiogram (ECG) is essential for healthcare professionals, as it serves as a window into the heart's electrical activity and overall health. The ECG graph not only provides critical insights into cardiac function but also plays a pivotal role in diagnosing various cardiovascular conditions.
However, amidst the complexities of heart rhythms and potential signal distortions, clinicians face significant challenges in accurately interpreting these vital readings. This article delves into the fundamental components of a normal ECG, the challenges of analysis, and the transformative impact of advanced technologies, including AI and automation, on enhancing diagnostic accuracy and patient care.
Explain the Basics of ECG: Function and Importance
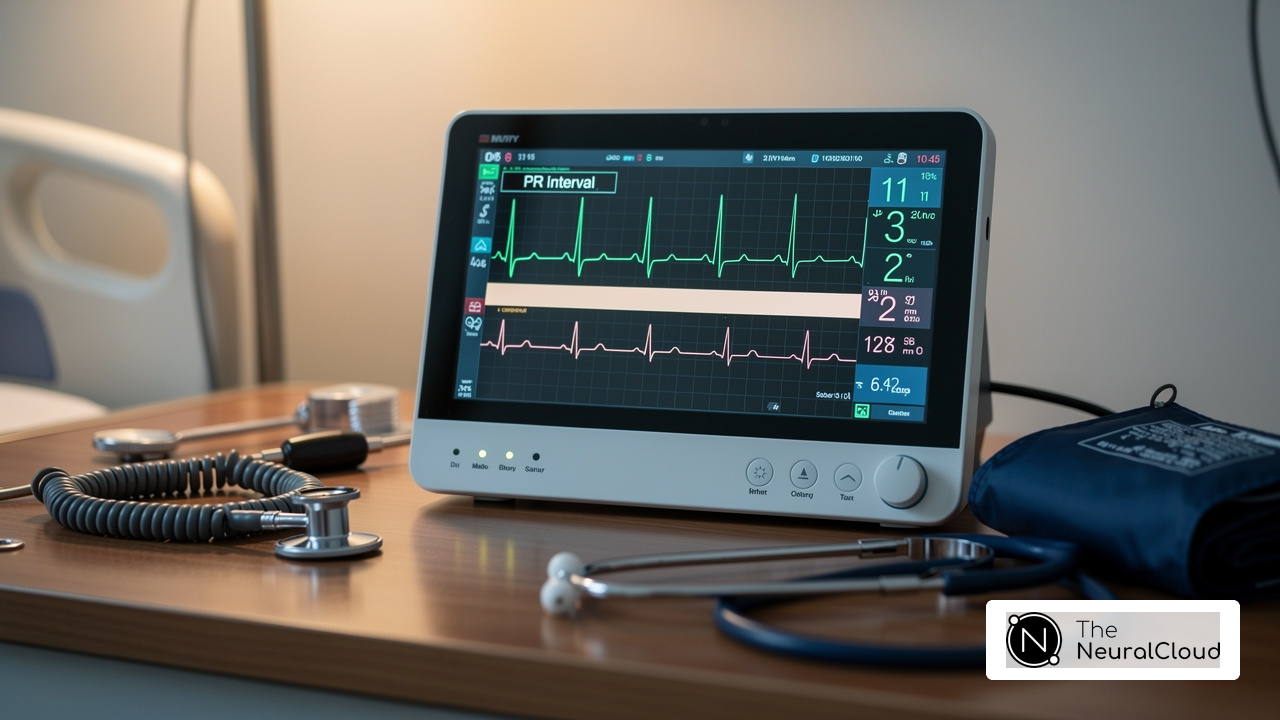
Electrocardiography (ECG) is a vital diagnostic tool over time, and an ECG reflects a healthy heart. Its primary function is to detect irregularities in cardiac rhythm, identify various cardiovascular diseases, and monitor cardiac health, ensuring that the heart's rhythm is maintained across different medical conditions. In clinical settings, ECGs provide real-time data that can prompt timely interventions, significantly impacting patient outcomes.
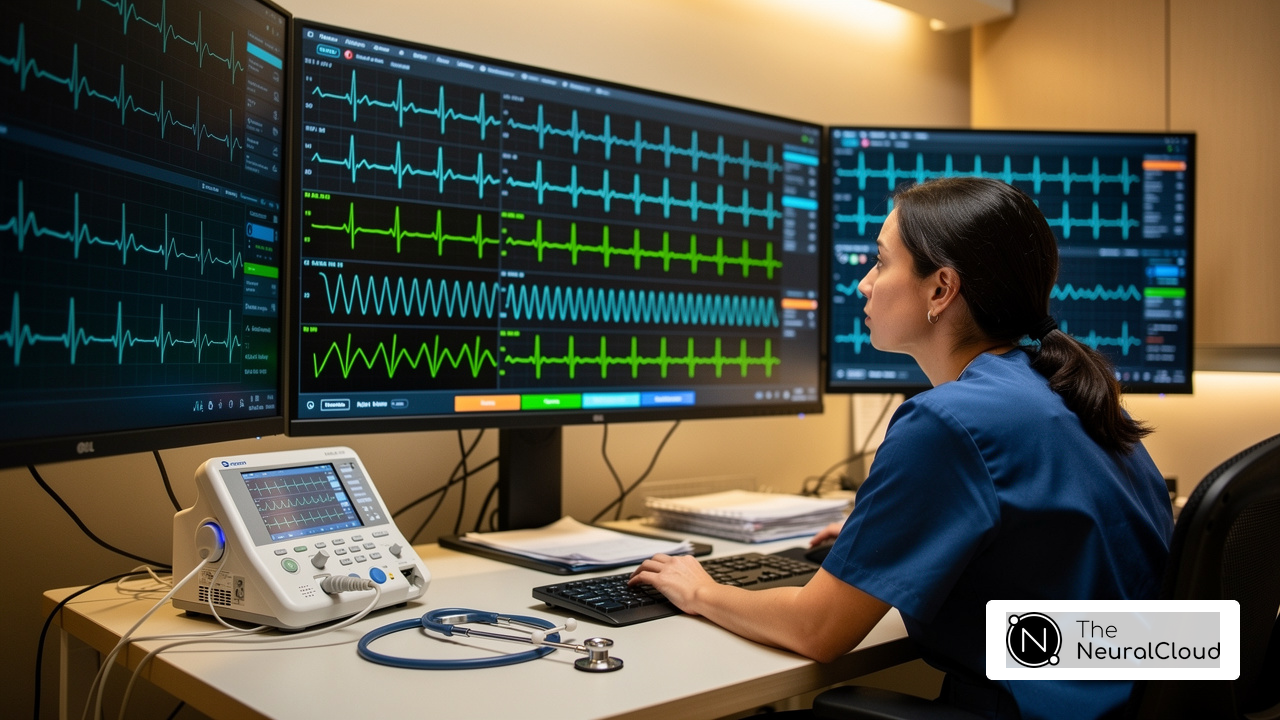
The ability of the ECG to unveil critical information, including heart rate, rhythm, and electrical conduction pathways, makes it an indispensable tool for cardiologists and healthcare professionals. Recent advancements in electrocardiography technology, particularly with Neural Cloud Solutions' offerings, enhance the accuracy and efficiency of ECG readings. These systems deliver beat-by-beat evaluations of up to 200,000 heartbeats in less than 5 minutes. It also identifies P-wave, QRS complex, and T-wave onsets and offsets, facilitating improved identification of conditions like arrhythmias. This is crucial, as research indicates that over 80% of patients are recognized during emergency admissions.
Incorporating patient-reported outcome measures (PROMs) in clinical studies further underscores the importance of recording patients' perspectives on their health, affirming the role of ECG in comprehensive patient care. As healthcare evolves, the ability of the ECG to provide accurate assessments remains paramount. This ensures that healthcare professionals can make informed decisions.

Identify Key Components of a Normal ECG: P-Wave, QRS Complex, and T-Wave
A normal ECG comprises several key components, each reflecting distinct phases of the heart's electrical cycle:
- P-Wave: This wave signifies atrial depolarization, occurring as the atria contract to propel blood into the ventricles. Typically, it appears small and rounded, with a of up to 2.5 mm.
- QRS Complex: A critical element representing ventricular depolarization, the QRS complex indicates the ventricles contracting to pump blood throughout the body. It is characterized by sharp, tall spikes, indicating an ranging from 0.08 to 0.10 seconds. Abnormalities in the QRS duration, particularly if it exceeds 0.12 seconds, may suggest conduction system dysfunction, such as a bundle branch block.
- T-Wave: Following the QRS complex, the T-wave represents ventricular repolarization, marking the recovery phase after contraction. This wave is typically wider and more rounded than the P-wave, indicating the body's return to its resting state.
Grasping these elements is crucial for medical professionals, as they offer and the identification of potential cardiac issues. For instance, the presence of pathological Q-waves in two contiguous leads can indicate previous myocardial infarction, underscoring the importance of in clinical settings. Recent studies have shown that up to 20% of Q-wave infarctions may occur without symptoms, highlighting the need for vigilant monitoring and assessment of ECG findings.
The addresses common challenges in through advanced technologies. It utilizes complex noise filtering and unique wave identification to enhance diagnostic accuracy. By swiftly isolating ECG waves from recordings impacted by noise and artifacts, the platform significantly improves analysis efficiency.
Healthcare professionals can optimize the advantages of MaxYield™ by considering specific use cases, such as analyzing lengthy or identifying subtle changes in ECG patterns that may indicate underlying cardiac conditions. This targeted approach allows for more effective monitoring and assessment of patient heart health.

Address Challenges in ECG Analysis: Noise and Signal Artifacts
can be significantly impacted by noise, which obscure the true electrical activity of the heart. Common sources of noise include:
- devices such as mobile phones or electrical equipment
- interference during recording
- Poor electrode contact resulting from inadequate skin preparation or electrode placement
Addressing these challenges is essential for accurate ECG interpretation.
The platform utilizes advanced technologies, including AI algorithms, to filter out noise and artifacts. It quickly labels P, QRS, and T wave onsets and offsets, while offering beat-by-beat tabulation in CSV format. This capability enables users to analyze more data in a shorter time, delivering clear data sets and clean signals.
This innovative approach not only improves analysis but also supports the discovery of new insights, making ECG interpretation more reliable and effective. Real-world applications of the platform have demonstrated its potential to transform patient monitoring, providing healthcare professionals with the tools necessary for enhanced patient care.

Leverage Advanced Technologies for Enhanced ECG Analysis: The Role of AI and Automation
The integration of technology, particularly AI and automation, has revolutionized ECG analysis. Platforms such as MaxYield™ and other advanced tools improve the clarity of signals, enabling medical professionals to concentrate on high-level decision-making instead of manual tasks. Key benefits include:
- Speed: Automated analysis can enhance efficiency, significantly reducing the time required for interpretation. This allows clinicians to respond more quickly to patient needs.
- Accuracy: AI algorithms continuously learn and adapt, improving performance by effectively handling physiological variability. Studies indicate that AI models can achieve detection accuracies of 96-97% for irregular heart rhythms, outperforming traditional methods.
- Scalability: The technology is flexible, allowing it to work with various ECG devices, making it versatile for different clinical environments. This adaptability ensures that medical providers can implement the technology across diverse settings without significant infrastructure changes.
By leveraging these advancements, healthcare providers can maximize their diagnostic yield and optimize resource allocation, ultimately enhancing patient care. The impact of automation in ECG interpretation is profound, as it not only increases efficiency but also empowers clinicians to make informed decisions based on accurate data.

Conclusion
The ECG graph serves as a critical indicator of cardiac health, encapsulating the heart's electrical activity through its key components: the P-wave, QRS complex, and T-wave. Understanding these elements is essential for healthcare professionals, as they provide vital insights into heart function and potential abnormalities. The advancements in technology, particularly through platforms like MaxYield™, enhance the accuracy and efficiency of ECG analysis, allowing for timely interventions that can significantly improve patient outcomes.
The importance of the ECG in diagnosing and monitoring cardiovascular conditions has been emphasized throughout this article. AI and automation play a transformative role in streamlining ECG analysis, mitigating challenges such as noise and artifacts. By automating waveform identification and improving signal clarity, these technologies empower clinicians to focus on critical decision-making, ultimately enhancing patient care.
As the landscape of healthcare continues to evolve, maintaining a normal ECG graph is paramount. Embracing advanced technologies optimizes diagnostic processes and fosters a proactive approach to cardiac health management. It is essential for healthcare providers to leverage these innovations to ensure accurate assessments and improve patient outcomes in cardiovascular care.
Frequently Asked Questions
What is electrocardiography (ECG)?
Electrocardiography (ECG) is a non-invasive method for recording the heart's electrical activity over time, which helps in detecting irregularities in cardiac rhythm and identifying various cardiovascular diseases.
Why is ECG important in clinical settings?
ECG is important because it provides real-time data that can prompt timely interventions, significantly impacting patient outcomes and ensuring that cardiac health is monitored effectively.
What information can an ECG graph reveal about heart function?
An ECG graph can reveal essential information about heart rate, rhythm, and electrical conduction pathways, making it a crucial tool for cardiologists and healthcare professionals.
How has technology improved ECG readings?
Recent advancements, such as Neural Cloud Solutions' MaxYield™, enhance the accuracy and efficiency of ECG readings by automating the analysis process and delivering beat-by-beat evaluations of up to 200,000 heartbeats in less than 5 minutes.
What specific features does MaxYield™ provide?
MaxYield™ identifies P-wave, QRS complex, and T-wave onsets and offsets, which aids in the improved identification of conditions like cardiac failure.
How significant is the identification of cardiac failure through ECG?
Research indicates that over 80% of cardiac failure patients are recognized during emergency admissions, highlighting the critical role of ECG in timely diagnosis.
What role do patient-reported outcome measures (PROMs) play in ECG studies?
Incorporating PROMs in clinical studies emphasizes the importance of recording patients' perspectives on their health, reinforcing the role of ECG in comprehensive cardiovascular disease management.
How does ECG contribute to informed decision-making in healthcare?
The ability of ECG to provide critical insights into cardiac health ensures that healthcare professionals can make informed decisions based on accurate and reliable data.
List of Sources
- Explain the Basics of ECG: Function and Importance
- bjcardio.co.uk (https://bjcardio.co.uk/2024/08/embedding-innovation-in-clinical-practice-to-improve-patient-care-across-cardiovascular-disease)
- Identify Key Components of a Normal ECG: P-Wave, QRS Complex, and T-Wave
- nhcps.com (https://nhcps.com/pqrst-wave-explained-for-beginners?srsltid=AfmBOopVaSTgXjGr9xPZxQlQb-2H4lJ2NCHW_Yu-FoMYhRdvKOga8dJn)
- visiblebody.com (https://visiblebody.com/blog/decoding-the-heart-what-is-an-ecg)
- pmc.ncbi.nlm.nih.gov (https://pmc.ncbi.nlm.nih.gov/articles/PMC9118877)
- What’s an EKG? (https://my.clevelandclinic.org/health/diagnostics/16953-electrocardiogram-ekg)
- ecgwaves.com (https://ecgwaves.com/topic/ecg-normal-p-wave-qrs-complex-st-segment-t-wave-j-point)
- Address Challenges in ECG Analysis: Noise and Signal Artifacts
- hillrom.com (https://hillrom.com/en/knowledge/article/three-factors-that-could-be-impacting-your-ecg-interpretation)
- theneuralcloud.com (https://theneuralcloud.com/post/master-ecg-artefacts-strategies-for-accurate-analysis-and-mitigation)
- Guide to Understanding ECG Artifact | ACLS Training Blog (https://aclsmedicaltraining.com/blog/guide-to-understanding-ecg-artifact)
- pmc.ncbi.nlm.nih.gov (https://pmc.ncbi.nlm.nih.gov/articles/PMC7357458)
- pmc.ncbi.nlm.nih.gov (https://pmc.ncbi.nlm.nih.gov/articles/PMC9736764)
- Leverage Advanced Technologies for Enhanced ECG Analysis: The Role of AI and Automation
- cardiologs.com (https://cardiologs.com/newsandevents/study-validates-reduction-of-ecg-analysis-time-when-using-cardiologs-to-detect-major-arrhythmias-vs-conventional-solution-with-similar-accuracy)
- cureus.com (https://cureus.com/articles/376607-investigating-the-efficacy-of-ai-powered-innovations-in-ecg-analysis-and-continuous-heart-monitoring-a-comprehensive-narrative-review)
- pmc.ncbi.nlm.nih.gov (https://pmc.ncbi.nlm.nih.gov/articles/PMC9777836)
- mdpi.com (https://mdpi.com/2079-9292/14/9/1837)
- heartrhythmopen.com (https://heartrhythmopen.com/article/S2666-5018(24)00298-8/fulltext)