Introduction
A normal ECG graph serves as a vital window into the heart's electrical activity, revealing intricate details about rhythm and health. Understanding its key features—such as the P-wave, QRS complex, and T-wave—enables healthcare professionals to diagnose a range of cardiac conditions, from arrhythmias to heart attacks.
However, misconceptions about ECG readings persist, leading to potential misdiagnoses and missed opportunities for timely intervention. This article will explore the critical insights gained from a thorough examination of a normal ECG, alongside how advanced technologies can enhance this essential diagnostic tool.
Define Normal ECG Graph: Key Features and Structure
A normal ECG, also known as an electrocardiogram, visually displays the electrical activity of the heart over time, usually as a sequence of waves and intervals that correspond to the heart's electrical impulses. The main elements of a standard ECG consist of the P-wave, QRS complex, and T-wave, each representing different stages of the heart cycle. The P-wave indicates atrial depolarization, the QRS complex represents ventricular depolarization, and the T-wave signifies ventricular repolarization.
The structure of the ECG is characterized by its distinct peaks and troughs, measured in millivolts (mV) and time (seconds). For instance, the average amplitude of the P-wave is about 0.1 mV, while the QRS complex typically ranges from 1.0 to 1.5 mV. Grasping this structure is essential for interpreting the rhythm of the heart and diagnosing potential issues.
In clinical settings, the interpretation of ECGs is vital for diagnosing conditions such as arrhythmias and myocardial infarctions. A study analyzing 757 ECG-related studies highlighted the importance of accurate waveform classification in patient care. Cardiologists emphasize that recognizing the components of the ECG is essential for effective diagnosis and treatment.
Typically, an ECG will show a consistent pattern of these waves, with intervals such as:
- PR interval (the time from the onset of the P-wave to the start of the QRS complex)
- QT interval (the time from the start of the QRS complex to the end of the T-wave)
These intervals are critical for assessing heart health. The American Heart Association recommends a minimum sampling rate of 500 Hz for standard diagnostic ECGs to ensure accurate readings.
The 'Neural Cloud Solutions' platform enhances this process by utilizing advanced noise filtering and wave recognition techniques. By rapidly isolating and labeling key features in every heartbeat, this system transforms noisy recordings into detailed insights, enabling healthcare professionals to make informed decisions based on precise cardiac data. This addresses challenges such as physiological variability and signal artifacts, significantly improving the efficiency of cardiac assessments. Notably, this system can analyze 200,000 heartbeats in under 5 minutes, further streamlining the diagnostic process.
Overall, a thorough understanding of the ECG and its waves and intervals, combined with the innovative capabilities of MaxYield™, is fundamental for healthcare professionals. This knowledge enables them to provide accurate diagnoses and make confident clinical decisions.
at the center, branching out to its essential components. Each branch explains a part of the ECG, helping you understand how each wave and interval contributes to heart function.
Explain the Importance of a Normal ECG in Cardiac Health
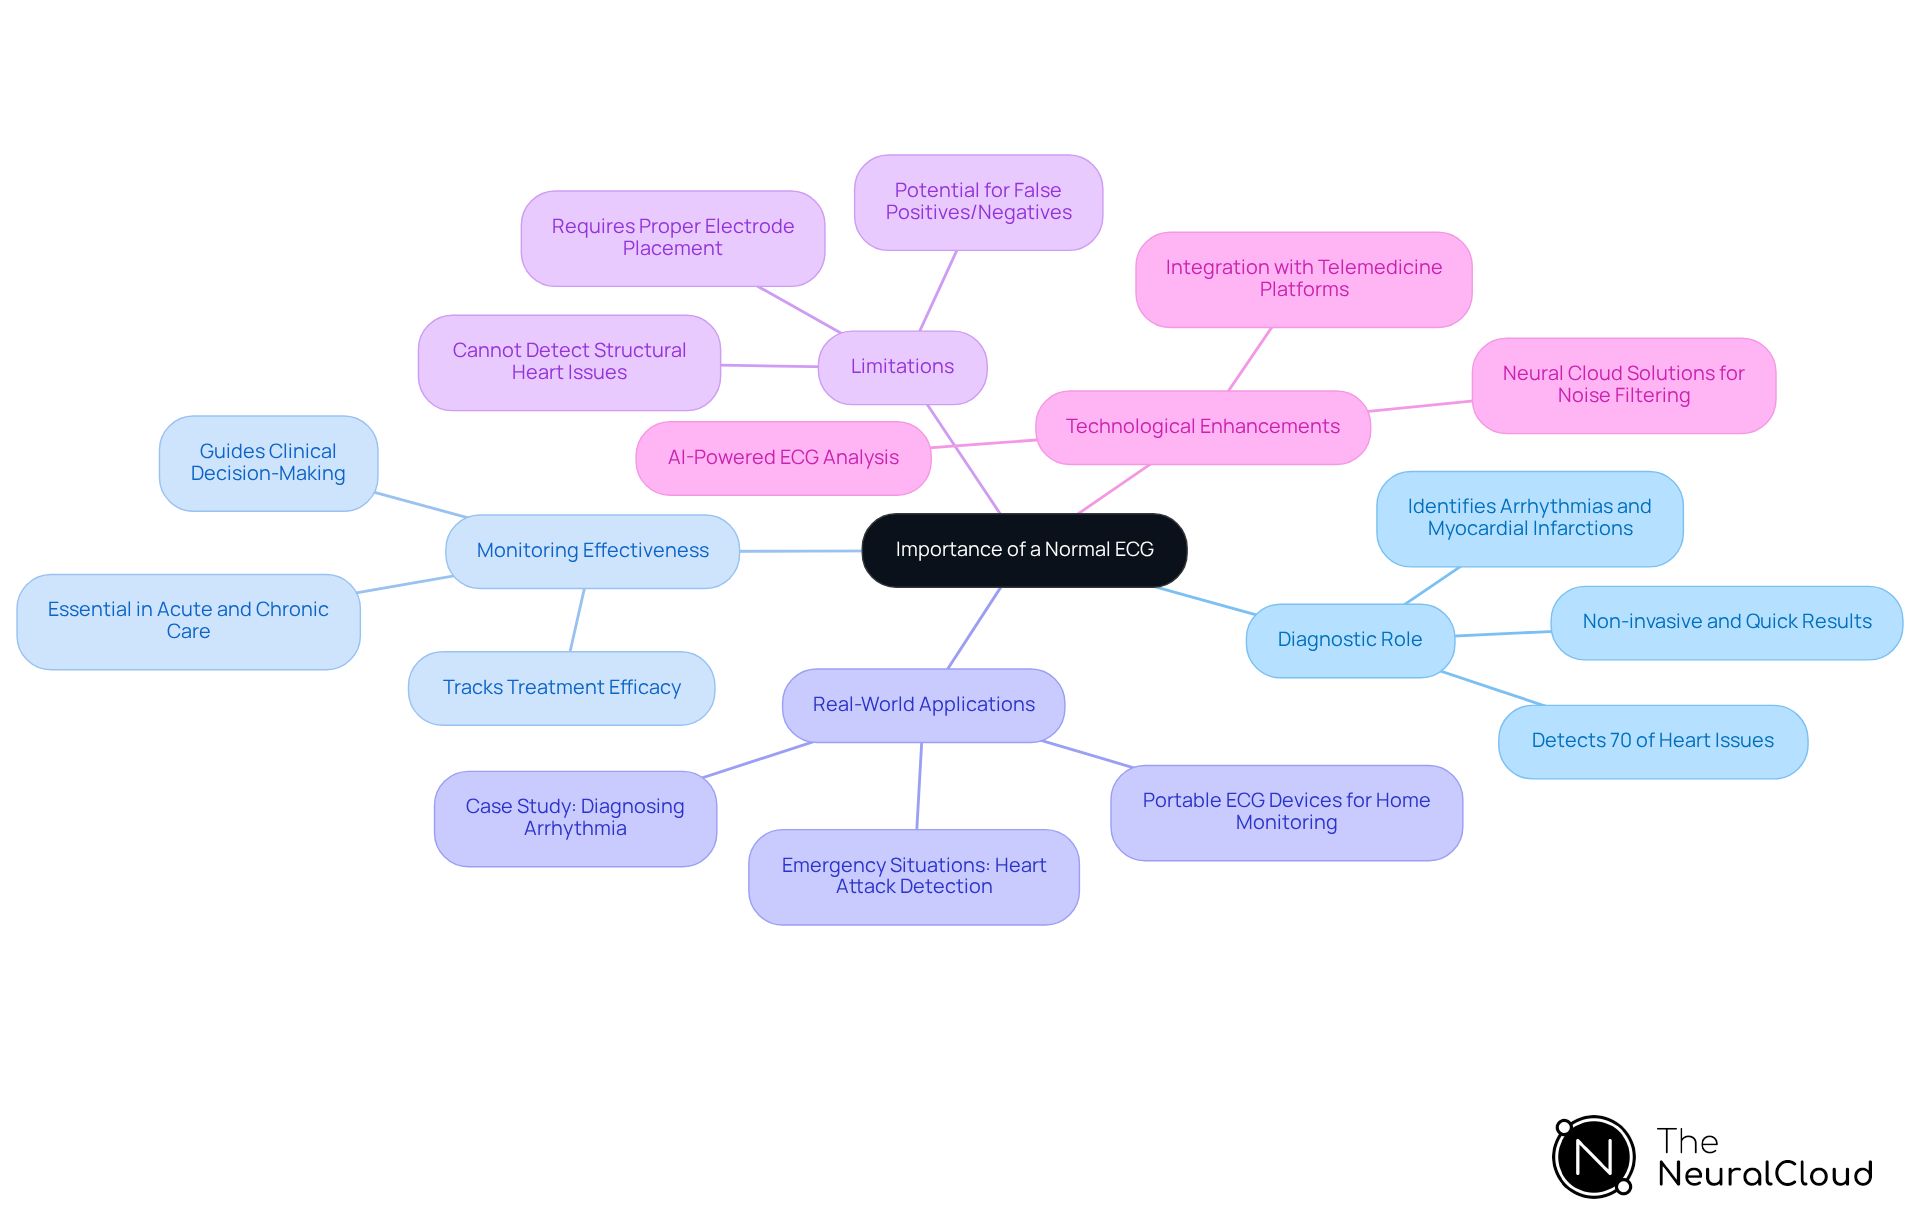
The ECG serves as a fundamental tool in cardiac health, providing vital insights into the heart's rhythm, rate, and electrical conduction. It plays a crucial role in diagnosing a range of conditions, including arrhythmias and heart disease. Research suggests that ECGs are essential in preventive care. By meticulously analyzing the ECG, healthcare professionals can uncover abnormalities that may elude detection during a physical examination.
Regular monitoring is essential for tracking the effectiveness of treatments and interventions, making it indispensable in both acute and chronic cardiac care. In emergency situations, ECGs can swiftly reveal signs of heart attacks, enabling timely interventions that can save lives. The integration of Neural Cloud Solutions' platform enhances this process. With its advanced algorithms, this system allows for quicker and more reliable interpretations of ECG data, significantly improving diagnostic efficiency.
Real-world applications of ECGs underscore their importance; for example, a case study highlighted how a patient with unexplained dizziness was diagnosed with a serious arrhythmia through ECG testing, leading to immediate treatment. This illustrates the ECG's capacity to provide critical information, ultimately improving patient outcomes. However, it is important to note that while ECGs are invaluable, they also have limitations, such as the potential for false positives or negatives due to factors like patient movement or poor electrode contact.
In summary, the ECG is not merely a diagnostic instrument but a cornerstone of effective heart care, facilitating early detection and management of cardiac issues, especially when enhanced by advanced technologies like MaxYield™.
Break Down the Components of a Normal ECG: P-Wave, QRS Complex, and T-Wave
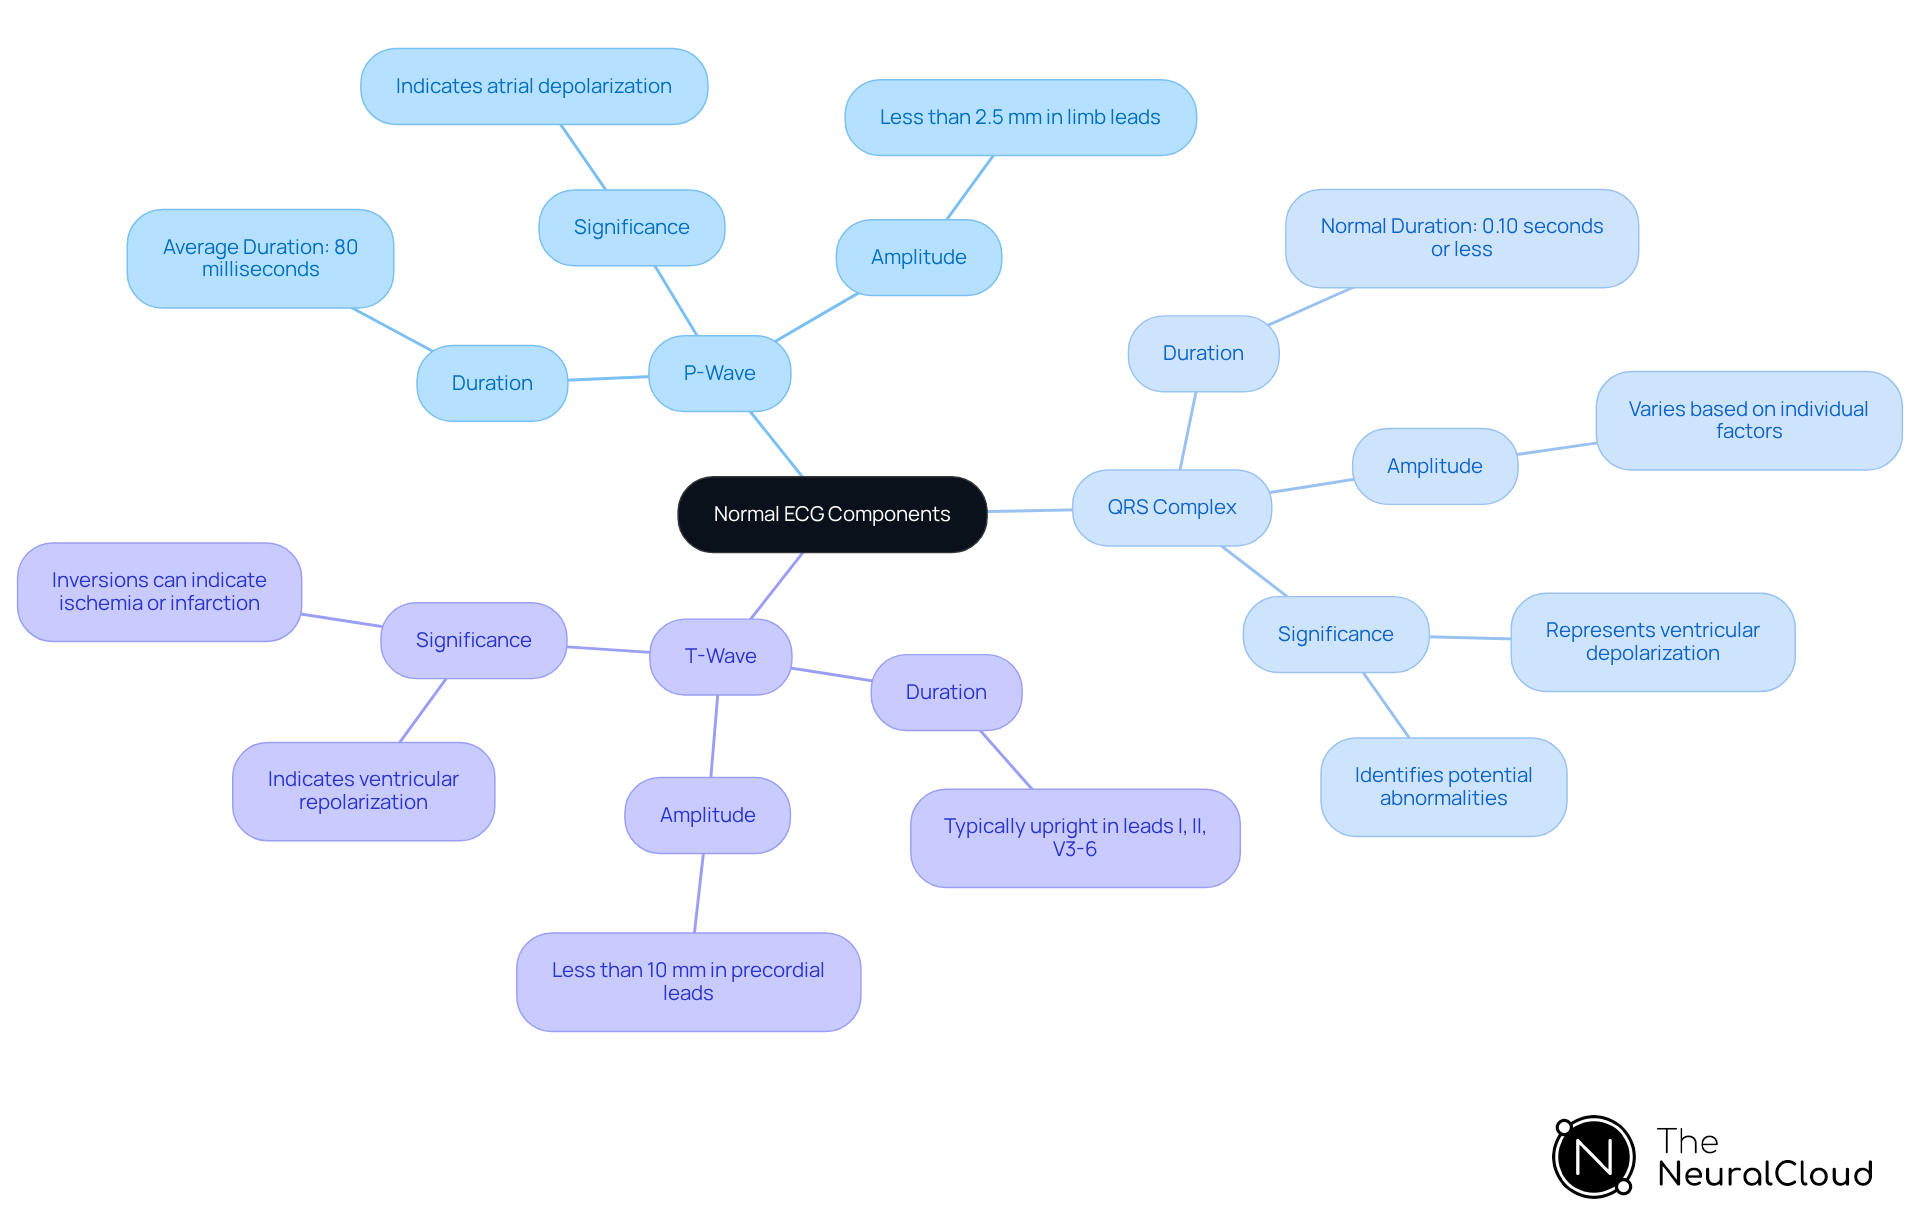
The typical ECG graph consists of three components: the P-wave, QRS complex, and T-wave, each critical for heart function. The P-wave signifies atrial depolarization, which reflects the electrical impulses initiating atrial contraction. It has an average duration of about 80 milliseconds and an amplitude of less than 2.5 mm in limb leads. Following this, the QRS complex represents ventricular depolarization, crucial for ventricular contraction. This complex is the most visually prominent feature of the ECG, with a normal duration of 0.10 seconds or less. Its amplitude can vary based on individual factors, making it vital for assessing ventricular activation and identifying potential abnormalities. Finally, the T-wave indicates ventricular repolarization, marking the recovery phase after contraction. Normal T-waves are typically upright in leads I, II, V3-6, and inverted in lead aVR, with an amplitude of less than 10 mm in precordial leads.
Understanding these components is essential for accurate diagnosis, particularly when evaluating arrhythmias. For instance, 'irregularly irregular' narrow QRS complexes are a hallmark feature in identifying atrial fibrillation, while ST-segment changes can indicate acute myocardial ischemia or prior myocardial infarction. The incorporation of advanced technology, such as the ECG analysis software, allows healthcare professionals to interpret data more effectively, transforming noisy recordings into detailed insights. This technology effectively maps ECG signals through noise, providing beat-by-beat analysis and the capability to analyze 200,000 heartbeats in under 5 minutes, aiding in confident clinical decisions.
Cardiologists emphasize that accurate interpretation of these components is crucial. As one expert noted, "Errors in the analysis can lead to misdiagnosis, delaying the appropriate treatment." Each component of the ECG not only reflects the electrical activity of the heart but also offers critical insights into its overall health and function. The advanced capabilities of the ECG analysis software further enhance this understanding, providing healthcare professionals with the tools necessary for effective patient care.
Address Common Misconceptions About Normal ECGs and Their Limitations
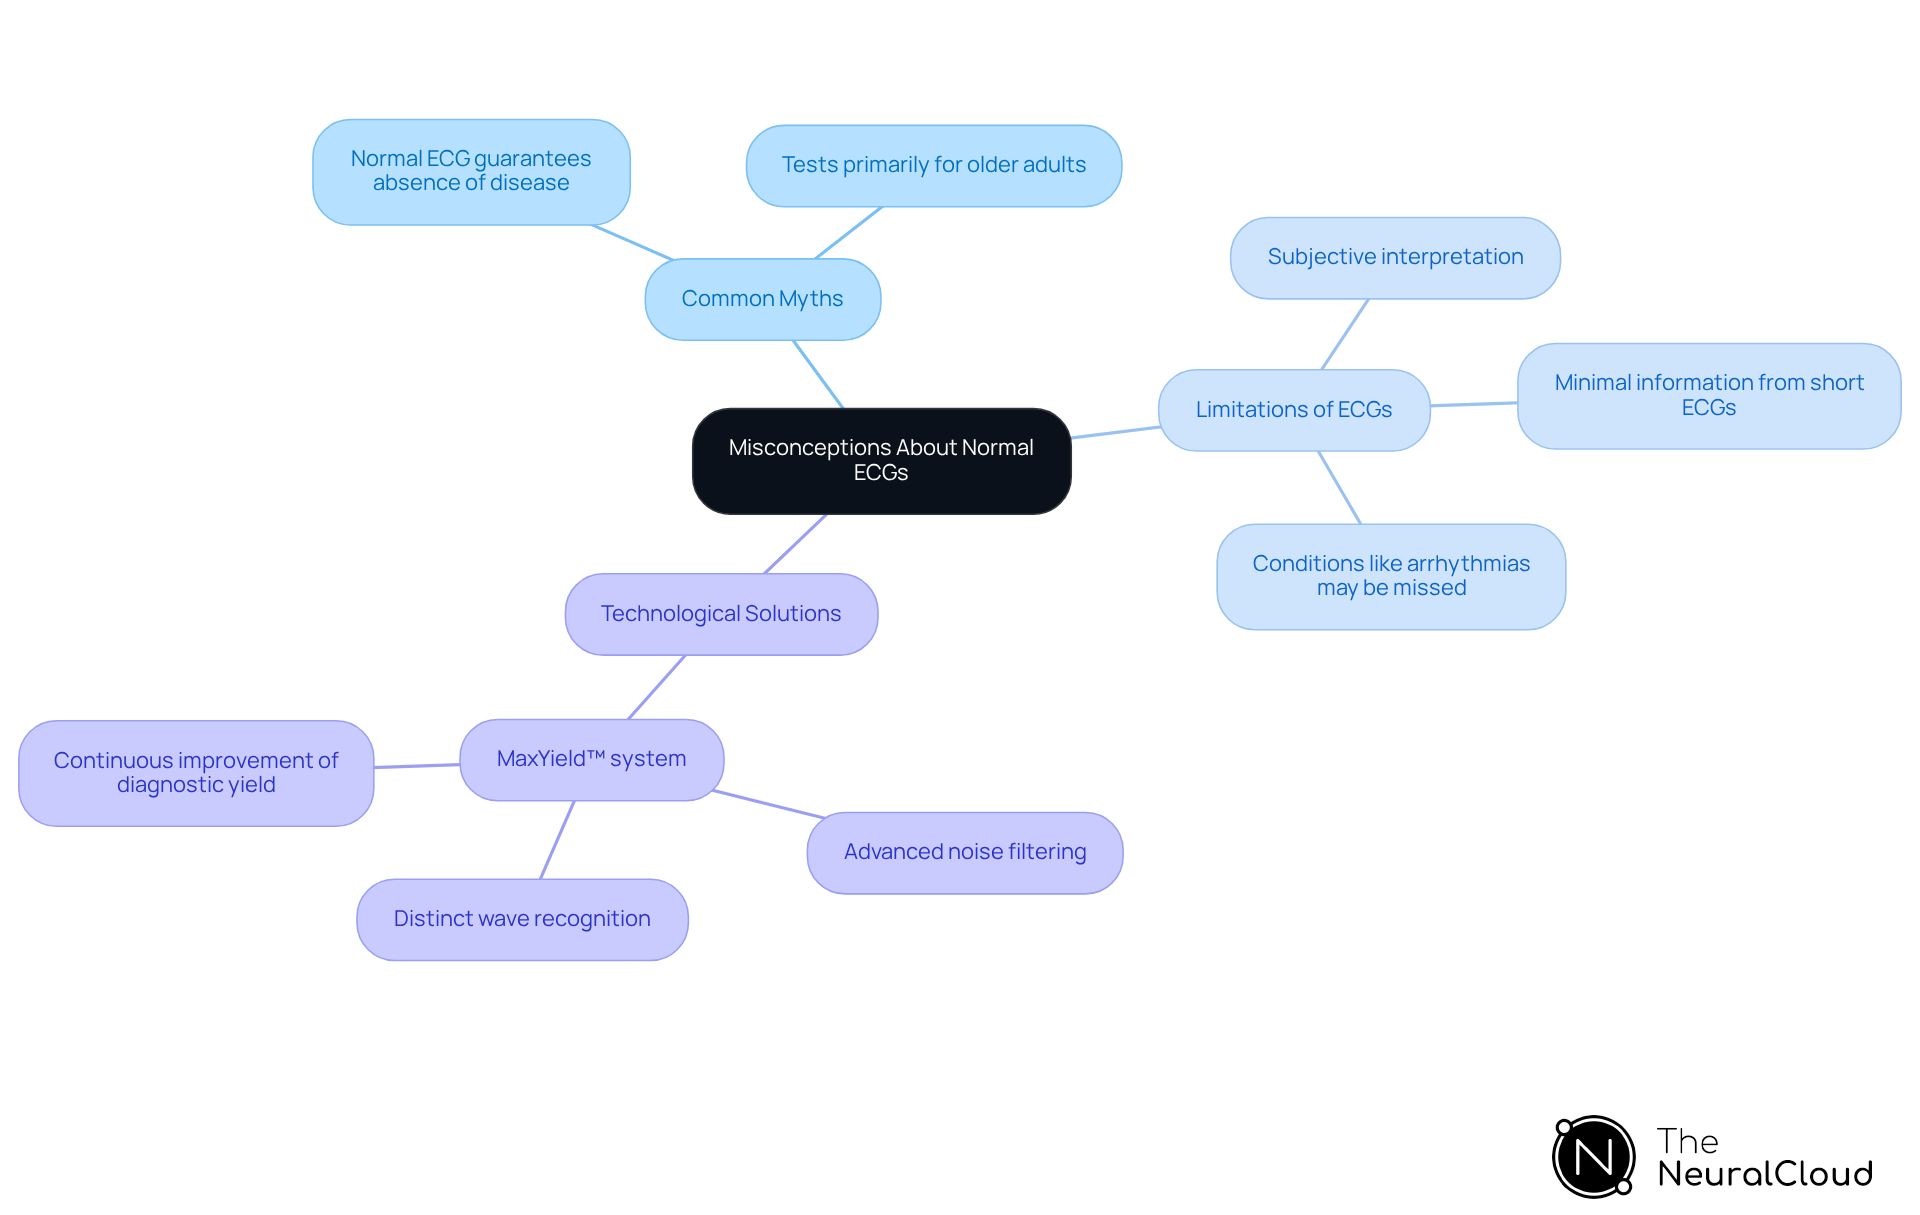
Despite their widespread use, normal ECGs can be misunderstood. A common myth is that a normal ECG guarantees the absence of cardiovascular disease; however, studies indicate that a significant percentage of such conditions can remain undetectable by standard ECGs. For example, a 2-minute ECG provides only 0.15% of the information regarding cardiac events, highlighting the necessity for additional diagnostic tests, such as Holter monitors, particularly for intermittent arrhythmias.
The interpretation of ECGs can also be subjective, influenced by individual patient factors like age, sex, and underlying health conditions. For instance, younger individuals with symptoms or a family history of heart disease may still require further testing, despite the common belief that these tests are primarily for older adults. Furthermore, variations in heart rhythm can lead to misinterpretations, potentially compromising patient care.
Real-world examples underscore these limitations; abnormal findings necessitating further evaluation through echocardiograms or other advanced diagnostic tools. Understanding these limitations is essential for healthcare professionals to avoid misdiagnosis and ensure comprehensive patient care.
The integration of Neural Cloud Solutions' platform effectively addresses these challenges. The system utilizes advanced algorithms and distinct wave recognition to enhance ECG analysis, enabling rapid isolation of critical data even in recordings affected by noise and artifacts. The algorithm evolves with each use, continuously improving its diagnostic yield and ensuring that previously obscured sections of lengthy recordings can be salvaged. This capability ultimately leads to improved patient outcomes.
As Dr. Sosa notes, "We must understand these limitations to avoid misdiagnosis and ensure comprehensive patient care." By leveraging technologies like MaxYield™, the healthcare industry can significantly enhance the efficiency and reliability of ECG interpretations.
Conclusion
The normal ECG graph serves as a vital diagnostic tool, providing a comprehensive view of the heart's electrical activity, which is essential for assessing cardiac health. Understanding key features such as the P-wave, QRS complex, and T-wave enables healthcare professionals to accurately interpret heart rhythms and identify potential abnormalities. This knowledge is crucial not only for effective diagnosis but also for timely interventions that can significantly impact patient outcomes.
Throughout this article, we have emphasized the importance of the normal ECG graph, highlighting its role in diagnosing various heart conditions, including arrhythmias and myocardial infarctions. The integration of advanced technologies, such as the Neural Cloud Solutions platform, further enhances the accuracy and efficiency of ECG interpretations. This enables healthcare providers to make informed clinical decisions based on precise cardiac data. Additionally, addressing common misconceptions and limitations surrounding ECG readings is essential for ensuring comprehensive patient care.
In light of the critical insights provided, it is evident that a thorough understanding of normal ECG graphs is indispensable for healthcare professionals. Regular ECG monitoring and the adoption of innovative diagnostic tools can lead to improved detection and management of heart conditions. Embracing these advancements not only enhances diagnostic yield but also contributes to better patient care and outcomes in the field of cardiology.
Frequently Asked Questions
What is a normal ECG graph?
A normal ECG graph, or electrocardiogram, visually displays the electrical activity of the heart over time, represented by a sequence of waves and intervals that correspond to the heart's electrical impulses.
What are the main components of a standard ECG?
The main components of a standard ECG include the P-wave, QRS complex, and T-wave. The P-wave indicates atrial depolarization, the QRS complex represents ventricular depolarization, and the T-wave signifies ventricular repolarization.
How are the features of an ECG graph measured?
The features of an ECG graph are measured in millivolts (mV) and time (seconds). For example, the average amplitude of the P-wave is about 0.1 mV, while the QRS complex typically ranges from 1.0 to 1.5 mV.
Why is interpreting ECG graphs important in clinical settings?
Interpreting ECG graphs is crucial for diagnosing conditions such as arrhythmias and myocardial infarctions. Accurate waveform classification helps in detecting cardiac anomalies, particularly arrhythmias.
What are the key intervals in a normal ECG graph?
The key intervals in a normal ECG graph include the PR interval (the time from the onset of the P-wave to the start of the QRS complex) and the QT interval (the time from the start of the QRS complex to the end of the T-wave).
What is the recommended sampling rate for standard diagnostic ECGs?
The American Heart Association recommends a minimum sampling rate of 500 Hz for standard diagnostic ECGs to ensure accurate readings.
How does the 'Neural Cloud Solutions' platform improve ECG interpretation?
The 'Neural Cloud Solutions' platform enhances ECG interpretation by utilizing advanced noise filtering and wave recognition techniques, allowing for rapid isolation and labeling of key features in every heartbeat, thus transforming noisy recordings into detailed insights.
What is the efficiency of the MaxYield™ system in analyzing heartbeats?
The MaxYield™ system can analyze 200,000 heartbeats in under 5 minutes, significantly improving the efficiency of ECG interpretation and enabling healthcare professionals to make informed decisions based on precise cardiac data.
Why is understanding the normal ECG graph essential for healthcare professionals?
A thorough understanding of the normal ECG graph, its waves, and intervals is fundamental for healthcare professionals to enhance diagnostic yield and make confident clinical decisions regarding patient care.
List of Sources
- Define Normal ECG Graph: Key Features and Structure
- nyit.edu (https://nyit.edu/news/articles/using-ai-to-detect-ecg-abnormalities)
- Electrocardiogram (ECG or EKG) - Mayo Clinic (https://mayoclinic.org/tests-procedures/ekg/about/pac-20384983)
- mdpi.com (https://mdpi.com/1424-8220/25/10/2982)
- heartfoundation.org.au (https://heartfoundation.org.au/your-heart/medical-tests-for-heart-disease)
- broadinstitute.org (https://broadinstitute.org/news/machine-learning-model-finds-genetic-factors-heart-disease)
- Explain the Importance of a Normal ECG in Cardiac Health
- jamanetwork.com (https://jamanetwork.com/journals/jamainternalmedicine/fullarticle/2820721)
- Electrocardiogram - StatPearls - NCBI Bookshelf (https://ncbi.nlm.nih.gov/books/NBK549803)
- Normal Electrocardiography (ECG) Intervals: Normal Electrocardiography Intervals (https://emedicine.medscape.com/article/2172196-overview)
- careinsurance.com (https://careinsurance.com/blog/health-insurance-articles/ecg-the-detector-of-your-heart-activity)
- medicalsearch.com.au (https://medicalsearch.com.au/buying-guide/understanding-ecg-machines-and-electrocardiography/f/24929)
- Break Down the Components of a Normal ECG: P-Wave, QRS Complex, and T-Wave
- T wave (https://litfl.com/t-wave-ecg-library)
- neuropsychology.github.io (https://neuropsychology.github.io/NeuroKit/functions/ecg.html)
- ECG Learning Center - An introduction to clinical electrocardiography (https://ecg.utah.edu/lesson/3)
- Electrocardiogram - StatPearls - NCBI Bookshelf (https://ncbi.nlm.nih.gov/books/NBK549803)
- Normal Electrocardiography (ECG) Intervals: Normal Electrocardiography Intervals (https://emedicine.medscape.com/article/2172196-overview)
- Address Common Misconceptions About Normal ECGs and Their Limitations
- statnews.com (https://statnews.com/2015/11/08/silent-heart-attacks)
- ethosvet.com (https://ethosvet.com/news-article/myths-in-clinical-cardiology)
- sunfox.in (https://sunfox.in/blogs/common-myths-about-ecg)
- medicalnewstoday.com (https://medicalnewstoday.com/articles/trump-chronic-venous-insufficiency-cvi-diagnosis-explained-symptom-treatment)